Summary
This page presents the results of a survey consisting of a few questions related to animal welfare and suffering in general. It includes an interactive calculator that allows you to correlate answers to any two survey questions. Some tentative findings include:
- those who care more about animals are (unfortunately) more likely to believe that preserving the rainforest reduces wild-animal suffering
- though the result isn't statistically significant, more people claim that hearing about improvements in humane fish slaughter would reduce rather than increase their consumption of fish
- fewer than half of those surveyed favor creating new universes in a laboratory
- most people would want many years of extra happy life to compensate being burned for one minute, and almost half would not accept one minute of burning for any number of additional happy years (suggesting quite a negative-leaning pain-pleasure exchange rate).
This survey was just a quick initial test of some variables I was curious about. Any conclusions suggested by the data in this piece need to be replicated with further surveys that ask the questions in many different ways.
Contents
Survey setup
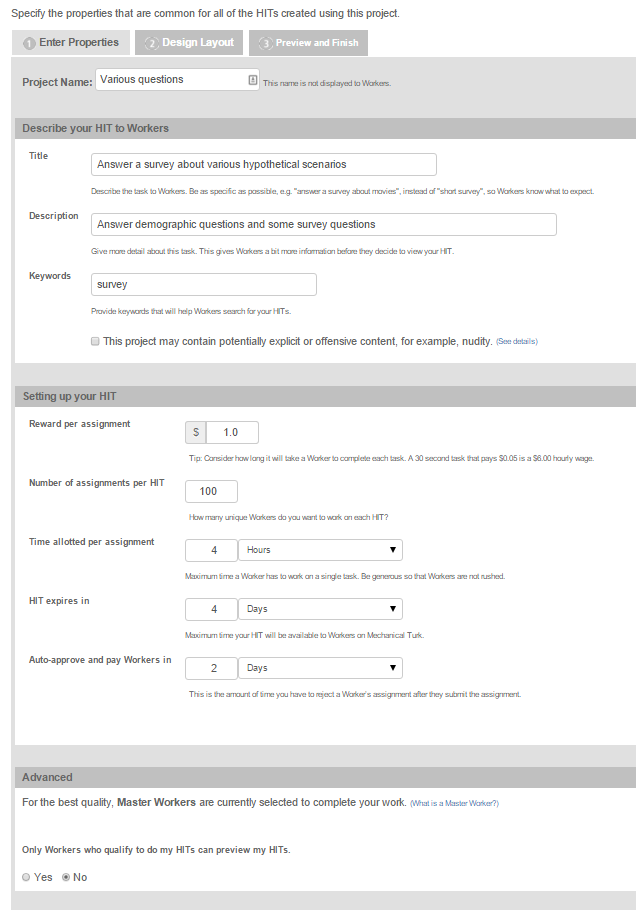
On 17 Nov. 2015, I ran a survey of a few questions on Mechanical Turk. This screenshot shows the properties I used. I kept the title and description quite vague to avoid selection bias in who answered the survey. Even though the survey had only 11 questions, I set the payment to be $1 for filling it out, because I wanted everyone who came across the survey to want to fill it out, whereas if I paid less, I would have self-selected for the subset of MTurkers who are more desperate.
I initially gave the survey to 100 people. Two of the answers came back incomplete, so I rejected them and got two other people to redo them. One other answer was incomplete, but I didn't notice until after I approved it, so I didn't rerun it; instead, I just removed it from the data file.
As a "quality assurance" check, I included the following question:
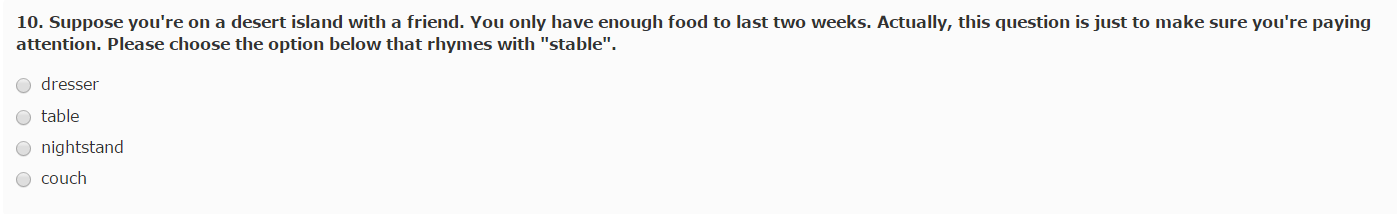
Everyone except the two rejected answers got this question right.
I created the survey using the simple survey-creation tool that Amazon provides. I just edited the source HTML by hand. The full HTML of the survey I submitted is here.
The survey was just a single page, with questions in a constant order. In the future, it might be better to randomize the question order to average out biases resulting from how the questions were ordered.
The answers were mostly done within a few hours of submission. Once all the answers were in, I downloaded the CSV from MTurk and stripped out the "id"-type fields, since I'm not sure if it's ok to share them publicly. I did that using this Python script, which also replaces comma separators with tabs. Then I uploaded the resulting TSV file here. The JavaScript on the current page (which you can see by viewing this page's source) reads in that file of results and computes the graphs and numbers shown below (although a few of the numbers I hard-coded).
All statistical tests in this piece are two-tailed.a
Results per question
This section describes the distribution of answers for each question. The possible answers to the question are usually clear from the bar chart of results, but where I want to write out the possible answers in full, I do so using bullets below the question text.
Gender
The question:
1. What is your gender?
The answers:
Age
The question:
2. What is your age?
The answers:
Education
The question:
3. Which of the following best describes your highest achieved education level?
The answers:
HouseHoldIncome
The question:
4. What is the total income of your household?
The answers:
Eating fish
The question:
5. Suppose you read the following in a news article: "A few fishing companies are beginning to use electrical stunning of the fish caught on their boats to significantly reduce the suffering the fish experience prior to death." Relative to before reading this, are you
- more likely to eat fish in the future
- less likely to eat fish in the future
- equally likely to eat fish in the future
The answers:
Looking just at the counts of "less" vs. "more" answers (ignoring the "equal" answers), the confidence interval for the proportion of "less" answers is to . While this interval includes 0.5, it's still suggestive of a greater proportion who say they'd eat less fish. Of course, social-desirability bias may be in play, but I wouldn't have expected a big social-desirability bias given that the question seems to morally permit the respondent to say s/he'd eat fish. I wonder if the phrase "electrical stunning" puts people off, since they assume electrical stunning would be painful? Or maybe people are (correctly) reasoning that if only a few companies are now trying humane stunning, then most fish sold in stores are still killed very inhumanely. These questions could be explored in a follow-up study.
The reason I asked the question with the specification that only a few companies are trying humane slaughter is that this situation more accurately describes where the state of fish-stunning adoption will be for the next few decades.
Preserve rainforest
The question:
6. Does preserving the rainforest reduce the suffering of wild animals?
The answers:
The confidence interval for the proportion of "no" answers is to .
It's unsurprising that most people favor rainforest preservation, though I was slightly surprised that this many people explicitly thought that rainforest preservation reduces wild-animal suffering.
Robert Daoust mentions that this "question is equivocal" because failing to preserve the rainforest causes suffering to some wild animals (namely, those killed when the forest is burned or cut down). A better phrasing of the question for next time might be, e.g.: "Does destroying the rainforest cause more wild-animal suffering than it prevents?"
Animal suffering important
The question:
7. Is animal suffering one of the world's top moral issues?
The answers:
The confidence interval for the proportion of "no" answers is to .
Spread life to space
The question:
8. Some scientists have proposed spreading plant and animal life to other planets in the galaxy. Would you support such an undertaking?
The answers:
The confidence interval for the proportion of "no" answers is to .
Create lab universes
The question:
9. Physicists Alan Guth of MIT and Andrei Linde of Stanford University have discovered that it may be possible in the far future for an advanced civilization to create infinitely many new universes "in a laboratory" (i.e., via manipulating physical processes). These universes would quickly separate off from ours, and we would have no contact with them, but some would probably develop life of various kinds. Would you support creating these new universes if doing so was possible and cheap?
The answers:
The confidence interval for the proportion of "no" answers is to .
I'm surprised that fewer people support creating lab universes. I would have predicted the opposite.
Pain-pleasure tradeoff
The question:
11. A genie appears in front of you and offers you the following deal: At the end of your life, you'll get an additional X years of happy, youthful, and interesting life if you first agree to be covered in gasoline and burned in flames for one minute. How big would X have to be before you'd accept the deal?
- between 0 and 1 years
- between 1 and 5 years
- between 5 and 15 years
- between 15 and 1 trillion trillion trillion years
- I would not accept regardless of how many extra years of life I would get
The answers:
I'm surprised that so many people share my strong aversion to intense suffering.
One possible problem with this question is that I didn't specify that the genie is known to be trustworthy. Perhaps some of the "I would not accept regardless..." answers are from people who assume the genie is tricking them? It would be good to fix this problem in a future survey.
Another potential problem that a friend pointed out is that some people might think their skin would remain burned indefinitely, whereas I intended that the genie would magically fix any bodily damage after the burning stopped.
Some have suggested that the results may have been biased by the scale of choices—e.g., people may have anchored to the big numbers presented. Follow-up surveys could let people enter their own numbers and could try different units (e.g., months instead of years).
There may be some additional confounding factors with this question as well, such as that people discount experiences further in the future or don't think they want to live extra years anyway due to cultural conditioning.
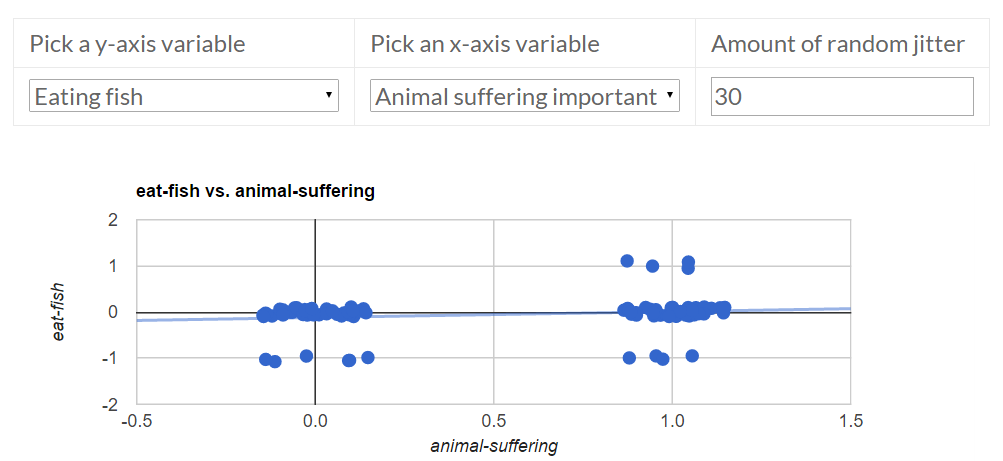
Correlating pairs of answers
A benefit of asking multiple questions in one survey is that we can study correlations among answers. In order to make the analysis simple, I converted all answers into numbers. For example, "no" becomes 0, "yes" becomes 1, "male" becomes 0, "female" becomes 1, and so on. Click the below button to see the full set of mappings from answers to numerical values. You can edit the numbers in the table to examine the sensitivity of the results to the choice of the label-to-number mapping.
Below you can look at pairwise correlations of any two variables. Because many answers are categorical (e.g., "yes" or "no"), it would be hard to see how many dots there are if I plotted the data points directly, since many would lie on top of one another. To address this problem, I added random jitter to each data point before plotting it. You can turn off the jitter by setting the jitter parameter to 0.
| Pick a y-axis variable | Pick an x-axis variable | Amount of random jitter |
Below is an ordinary least-squares regressionb of the two variables (using the original, un-jittered data). The regression equation is
= + *
| Statistics about the slope coefficient | ||
| Standard error | t-statistic | p-value |
| t-statistic | ||
Specific hypotheses
Following are some specific hypotheses that I wanted to test. I wrote down each hypothesis before looking at the results of the regression to avoid the file-drawer effect. (That said, I did see some of the per-answer distributional statistics before writing down these predictions.)
| Y variable | X variable | My prediction for the relationship before looking | Actual slope coefficient | p-value of slope coefficient | Was my prediction right? |
| Preserve rainforest | Animal suffering important | positive (animal rights and favorability towards conservation tend to co-occur) | 0.16 | 0.010 | I was correct about the sign and the significance level. |
| Spread life to space | Animal suffering important | no significant effect (not obvious which way it goes) | 0.03 | 0.763 | I was correct that the result wasn't statistically significant (hereinafter, "stat sig"). |
| Pain-pleasure tradeoff | Animal suffering important | positive (more compassionate people tend also to be more squeamish about suffering) | 0.87 | 0.385 | I was correct on the sign, but it wasn't stat sig. |
| Create lab universes | Pain-pleasure tradeoff | negative (more "macho" people don't mind pain as much and tend to favor creating universes more) but not stat sig | -0.00 | 0.993 | I was wrong; there's no relationship at all. |
| Create lab universes | Spread life to space | positive (both involve spreading life and dominating nature) | 0.46 | 0.000 | I was correct about the sign and the significance level. |
| Pain-pleasure tradeoff | Gender | positive (I expect women will be more averse to extreme pain) and stat sig | 2.88 | 0.004 | I was correct about the sign and the significance level. |
| Create lab universes | Gender | negative (women less inclined to create lab universes) but not stat sign | -0.42 | 0.000 | I was correct on the sign but wrong that it wouldn't be stat sig. |
| Spread life to space | Gender | negative (women less inclined to spread life) and stat sig | -0.59 | 0.000 | I was correct about the sign and the significance level. |
| Preserve rainforest | Gender | positive (women more inclined to think rainforest preservation reduces animal suffering) but not stat sig | 0.03 | 0.616 | I was correct about the sign and the significance level. |
All the gender differences could have been predicted from the (accurate) stereotype that men are on average more enthusiastic about conquering things without as much concern about causing destruction. The space-related answers could also be predicted from men on average being more interested in science fiction.
Footnotes
- I think one-tailed tests are often cheating, in the sense that they allow you to lower your p-value without much of a good reason for doing so, unless the distribution is actually one-sided. (back)
- Of course, it would theoretically be more proper to use logistic regression for discrete y variables, but that's more complicated, and in practice, ordinary least-squares works pretty well for even binary y variables. (back)