Summary
Not all animal foods are equal in terms of how much direct farm-animal suffering they cause per kilogram purchased. Farmed seafood may cause the most direct suffering, followed by eggs and poultry products. Pork, beef, and especially milk produce considerably less suffering in comparison. As an extreme case, creating demand for a kilogram of farmed catfish meat causes ~20,000 times as much direct suffering as creating demand for a kilogram of milk.
In addition to the suffering caused to the farm animals exploited for animal products, other factors are also relevant when comparing animal foods. For example, beef (especially grass-fed) may reduce wild-animal suffering on balance. However, beef also has a bigger climate-change impact per calorie than the other types of meat, though milk's impact is considerably lower than beef's. If you insist on eating animal protein, then dairy products—milk, cheese, or whey protein (which is low in fat and carbs)—may be a good compromise. Holden Karnofsky has developed a "Power Smoothie" with whey protein. Of course, if you just want high-density protein, consider the various plant-based protein powders: pea, hemp, spirulina, etc. More than just soy are available. (There's also rice protein powder, but I tend to avoid rice in case the impact on wild animals is worse than that of other crop types.)
By the way, vegans need non-dietary vitamin B12.
Note: In this piece I haven't yet analyzed lobster, shrimp, prawns, or other small seafood, but given the small sizes of these organisms, eating them may cause vast amounts of expected suffering per kilogram.
Translations:
- German: .pdf
An improved version of the calculator in this piece is this page by Evan Sandhoefner.
Contents
Introduction
Animals living on factory farms endure great amounts of suffering, enough that it's generally bad to bring them into existence by creating economic demand for meat. [FAL], via Wikimedia Commons: https://commons.wikimedia.org/wiki/File:ChickBeingDebeaked.jpg") If readers are unconvinced on this point, I recommend the vast collection of literature available online, including "Modern Animal Farming", "What Came Before", and, for a more rigorous survey, reports by the Humane Society of the United States.
If readers are unconvinced on this point, I recommend the vast collection of literature available online, including "Modern Animal Farming", "What Came Before", and, for a more rigorous survey, reports by the Humane Society of the United States.
Eating certain types of meat may cause more suffering than eating the same amount of another type of meat under otherwise identical circumstances. Below, I investigate how much direct suffering, on average, is caused by creating demand for a kilogram of different types of animal products. By "direct" suffering, I refer only to the suffering of the animal whose flesh, milk, or eggs is part of the animal product. I'm ignoring, therefore, the suffering of breeder animals (such as semi-starved "broiler breeder" chickens), male chicks who are ground up as part of the egg-production process, calves separated from their mothers in milk production, the contribution of milk production to the veal/beef industry, the large amounts of wild fish that are caught and fed to farmed fish, the fraction of farm animals that die before reaching slaughter, the environmental impacts of meat production, and potential health consequences of eating certain types of meat.
Results table
| Column 1 | 2 | 3 | 4 | 5 | 6 | 7 |
| Animal product | Average lifespan (days) | Boneless meat or other edible food per animal lifetime (kg) | Sentience multiplier for the species (max value = 1) | Suffering per day of life (beef cows = 1) | Number of days of life equivalent to pain of death | Equivalent days of suffering caused per kg demanded |
| Farmed catfish | ||||||
| Farmed salmona | ||||||
| Battery-cage eggs | ||||||
| Chickenb | ||||||
| Turkey | ||||||
| Porkc | ||||||
| Beef | ||||||
| Milkd |
In the above table, Column 2 is a point estimate of how long each farm animal lives before slaughter. Column 3 reports how much meat, eggs, or milk is produced in the lifetime of an animal. Sources for these inputs are described in the Appendix to this piece. Feel free to enter your own values into the table.
Column 4 allows you to give different degrees of cognitive and affective sophistication to different types of animals. For example, you would assign a sentience multiplier of 0.25 if you're only 25% certain that salmon can suffer, or if you think salmon can certainly suffer but their suffering only matters 25% as much as the suffering of a pig (assuming the default sentience value of 1.0 for pigs), or if you're 50% certain they can suffer and they suffer 50% as much as a pig if they do suffer, and so on. The default numbers in Column 4 are somewhat egalitarian among animal taxa even though the animals in question have very different brain sizes. Some people feel that the differences in brain size and complexity among the animals in the table should lead to much bigger differences in moral weight. If you agree, you can adjust the sentience multipliers.
Column 5 represents my best-guess estimates for how bad life is per day for each of type of farm animal, relative to that animal's intrinsic ability to suffer. That is, differences in cognitive sophistication aren't part of these numbers because they're already counted in Column 4. Rather, Column 5 represents the "badness of quality of life" of the animals. For instance, since I think the suffering of hens in battery cages is perhaps 4 times as intense per day as the suffering of beef cows, I put a "1" in the beef-cow cell and "4" in the egg cell.
Column 6 is a best-guess estimate of the average pain of slaughter for each animal, expressed in terms of an equivalent number of days of regular life for that animal. For instance, I used "10" as an estimate for broiler chickens, which means I assume that on average, slaughter is as painful as 10 days of pre-slaughter life.e
Finally, Column 7 represents suffering per kilogram of the animal product. It's calculated as follows:
Column 7 = [(Column 2) + (Column 6)] * (Column 4) * (Column 5) / (Column 3),
which, dimensionally, looks like this:
suffering / kg = [(days of life / animal) + (equivalent days from pain of death / animal)] * (suffering / poorness of life) * (poorness of life / day) / (kg / animal).
Limitations
A big drawback of the above calculation is that it ignores the nutrient densities of different animal products. For example, milk is mostly water, so 1 kilogram of milk has less protein and fewer calories than 1 kilogram of the other foods. If I were to rewrite this piece, I would calculate "suffering per calorie" or "suffering per gram of protein". Fortunately, other authors have taken the step of converting "mass of animal foods" into calories:
- "Number of Animals Killed to Produce One Million Calories in Eight Food Categories"
- "Want to Kill Fewer Animals? Give Up Eggs".
Another big drawback of these numbers is that I haven't considered price elasticities, which determine the degree to which reduced consumption of a product will ultimately lead to reduced production.
These calculations ignore secondary products like offal, leather, and tallow that can be produced from animals. Given the lower value of these products, my failure to account for them probably doesn't affect the results dramatically.
Finally, the above figures are per kilogram demanded, not necessarily per kilogram eaten. If you get your meat from dumpster diving (which I don't recommend), you're not causing suffering to other animals. There may be other, less extreme circumstances in which eating animal products doesn't contribute, or is less likely to contribute, to animal suffering.
Updated thoughts on this piece, May 2014
I'm somewhat less gung-ho about these numbers than when I first wrote this piece because in practice, the side effects of meat consumption on wild animals and Earth's long-run future probably matter much more than the (horrific) direct impacts on farm animals themselves. Of course, evaluating the net impact of these indirect side effects is much trickier.
Whatever the sign is of the indirect effects, indirect effects should be more similar across animals than the suffering figures are across animals, since cows and chickens don't differ as much in their environmental impacts as in their direct suffering per kilogram. Hence, these neglected factors should tend to drive the (absolute values of the) ratios of per-kilogram impact estimates across species closer toward 1.
If I were going to popularize anything from this analysis, it would be something like, "For people who don't want to go vegan, consider going lacto-vegetarian." I think the exercise of computing these numbers is a useful way to explore the details of animal production and challenge vague intuitions we may have about how much harm is done by a burger vs. a chicken wing, but I also wouldn't recommend taking these figures too literally.
Acknowledgments
This piece was inspired by Table 1, p. 583, of "Human diets and animal welfare: The illogic of the larder" by Matheny, G. and Chan, K.M.A. Similar figures appear in Table 1, pp. 326-27, of "Farm animal welfare, legislation, and global trade" by Matheny, J.G. and C. Leahy.
Many readers have given feedback on this article over the years. In 2020, Adam Spence pointed out a small error with my sentience multipliers.
See also
Steven L. Davis mentions:
Another alternative, suggested recently by PETA (2001), recommends that if we are going to eat meat, we should kill the largest animals possible, thereby reducing the number of animals that would need to die to feed humans [...]. In fact, they have suggested that blue whales, the largest known living animal would be the ideal choice.
Replying to Davis, Andy Lamey notes:
This simple difference between animal carcasses, surely obvious to any farmer, has potentially major implications for animal advocacy. In particular, it should cause animal advocates to recognize that not all meats are created equal. In terms of the number of animals killed, one serving of chicken represents two hundred servings of beef. Causing someone to give up chicken before beef would thus be a victory in itself. Although eliminating chicken alone should not replace veganism as animal protection’s ideal, it deserves serious consideration as the first step people are asked to take when it comes to changing their diet. This is especially so when one considers the large number of people who cut out red meat but keep eating chicken. They may actually be doing more harm than good when it comes to the overall number of animals killed, depending on whether their chicken consumption increases. In short, the issue of carcass size deserves far more attention than animal advocates have given it.
This SMBC cartoon discusses eating animals with the highest ratio of meat to sentience.
The site "One Step for Animals" encourages people to "Stop eating chickens" as the first step they take toward reducing suffering.
Scherer et al. (2018) calculates the animal-welfare loss of different animal products per million calories.
Warren (2018): "Suffering by the Pound: Meat and Animal Product Harm Comparisons".
Links to this piece
There's a nice infographic of this analysis on Think by Numbers.
Peter Hurford extends my analysis in his piece, "How Much Suffering is in the Standard American Diet?"
Appendix: Where the numbers came from
Here is a list, by animal, of where I got my assumptions for the values in columns 2 and 3 of the table above.
Haley and Jones (2017) report the following numbers (p. 1):
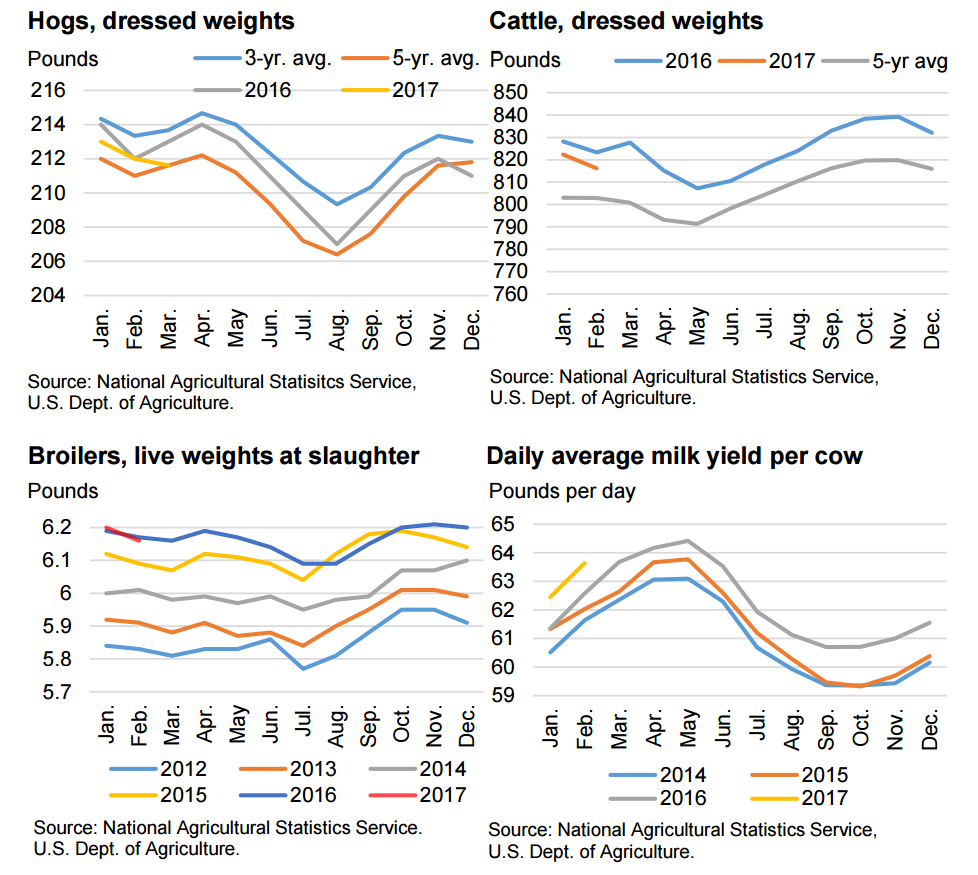
I'll compute these yields per animal myself below, but this figure allows for checking my numbers.
Pork
USDA (2017, "Livestock Slaughter") reports (p. 1) that for March 2017 in the USA, "Pork production totaled 2.27 billion pounds[...]. Hog slaughter totaled 10.7 million head[...]." This implies (2,270 million)/(10.7 million) = 212 pounds per hog. This number is not actually a weight of fully edible pork; rather, "Red meat production is the carcass weight after slaughter excluding condemnation" (USDA 2017, "Livestock Slaughter", p. 15). We can cross-check this by noting that the Haley and Jones (2017) figure above also says "dressed weights" and has values around 212 pounds per hog.
Raines (n.d.) gives a rule of thumb that 65% to 70% of carcass weight ends up as boneless pork. Assuming 67.5%, we have (212 pounds) * 0.675 = 143 pounds = 65 kg of boneless pork per hog.
PETA (n.d.): "pigs on factory farms are sent to slaughter after just six months of life." (365 days)/2 = 183 days.
Beef
USDA (2017, "Livestock Slaughter") reports (p. 1) that in March 2017 in the USA: "Beef production[ was] 2.25 billion pounds[...]. Cattle slaughter totaled 2.77 million head[...]." This implies (2,250 million)/(2.77 million) = 812 pounds per cow. As with pork, this is dressed weight, and Raines (n.d.) suggests that 55% to 60% (average = 57.5%) of carcass weight ends up as boneless beef. (812 pounds) * 0.575 = 467 pounds = 212 kg per cow.
HSUS (n.d.), p. 3: "For seven months, calves graze on the range before they are transported to feedlots, where they are fattened on unnatural diets. Within six months, they reach market weight of 544 kg (1,200 lb) and are trucked to slaughter." 7 + 6 months = 1 year and 1 month = 365 + 30 days = 395 days.
Apart from branding, castration, dehorning, etc., the grazing period of a beef cow's life may not be extremely painful. I would guess that the feedlot portion is worse but still probably not as bad as life for broiler chickens or pigs. For example, I think feedlots are often outdoors? For these reasons, I give beef cattle a lower degree of suffering per day of life than for the other farm animals.
Chicken
USDA (2017, "Poultry Slaughter") reports (p. 2) an "Average live weight" for all meat chickens of 6.16 pounds per bird in March 2017 in the USA.
Best (2011), speaking about broiler chickens: "assuming a weight yield of 75% at slaughter and that 10% of carcase weight is represented by bones, together with a typical cooking loss of 20%, the 2.5 kg live [weight] would be 1.35 kg of edible meat." Apparently Best (2011) is multiplying 2.5 * 0.75 * 0.9 * 0.8 to get 1.35. I don't want to count cooking losses because I don't think they're counted for my other meat types, so I'll just use the factors 0.75 * 0.9 = 0.675. (6.16 pounds) * 0.675 = 4.16 pounds = 1.9 kg of edible meat per chicken.
"Broiler" (2017): "Most commercial broilers reach slaughter-weight at between five and seven weeks of age". 6 weeks = 42 days.
Turkey
USDA (2017, "Poultry Slaughter") reports (p. 2) an "Average live weight" for all meat turkeys of 31.47 pounds per bird in March 2017 in the USA.
Assuming the same 0.675 multiplier as for chickens to convert live weight to edible weight, we have (31.47 pounds) * 0.675 = 21 pounds = 9.6 kg of edible meat per turkey.
"Further" (2007): "Turkeys are slaughtered at between 12 and 26 weeks [average = 19], depending on the size of bird being produced." 19 weeks = 133 days.
Milk
The graph from Haley and Jones (2017) shows a "Daily average milk yield per cow" of between 59 and 65 pounds per day. I'll take 61 pounds per day as a middling value.
Alberta Milk (n.d.): "The typical dairy cow lives an average of five years, with the first two years focused on providing a strong foundation for the healthy development of the cow. From age two, the mature cow will become a productive member of the milking herd (meaning, she will produce milk)."
So let's assume 3 years of milk production: (61 pounds per day) * (365 days per year) * (3 years) = 67,000 pounds = 30,000 kg of milk in a lifetime.
A "glass" of milk is 0.2366 liters ≈ 0.2366 kg. So in a lifetime, a cow produces about 30,000/0.2366 = 130,000 glasses of milk. That number is somewhat lower than a common trivia fact on the web that "A cow produces about 200,000 glasses of milk in her lifetime" ("Dairy Cattle Information" n.d., p. 33). Increasing the productive lifespan to 4 years instead of 3 would get closer to the 200,000 figure. And probably there's a lot of variance in these numbers.
Eggs
 in a factory farm battery cage.' By Compassion Over Killing [CC-BY-SA-3.0 (http://creativecommons.org/licenses/by-sa/3.0)], via Wikimedia Commons: https://commons.wikimedia.org/wiki/File:Animal_Abuse_Battery_Cage_01.jpg") Wepruk (n.d.): "Hens generally [begin] laying at 18 to 20 weeks of age. Normally they are considered spent between 71 and 72 [average = 71.5] weeks of age. Therefore, laying hens have a production lifespan of approximately one year. In that year, hens lay an average of 288 eggs each." (This doesn't count forced molting, which can extend the productive lifetime of hens.) A lifespan of 71.5 weeks is 501 days.
Wepruk (n.d.): "Hens generally [begin] laying at 18 to 20 weeks of age. Normally they are considered spent between 71 and 72 [average = 71.5] weeks of age. Therefore, laying hens have a production lifespan of approximately one year. In that year, hens lay an average of 288 eggs each." (This doesn't count forced molting, which can extend the productive lifetime of hens.) A lifespan of 71.5 weeks is 501 days.
USDA (2017, "Chickens and Eggs") reports (p. 7) a total of 2,480 "Eggs per 100 layers during March" of 2017 for "Table egg type" hens (i.e., hens laying eggs to eat rather than for hatching). With 31 days in March, that implies 2,480 / (100 * 31) = 0.800 eggs per hen per day. Over a year of laying, that would be 365 * 0.800 = 292 eggs, which basically matches the 288 number from the Wepruk (n.d.) quote.
Best (2011) assumes that "the edible contents of a 60-gram egg weighs 55 grams" or 0.055 kg. Multiplied by 288 eggs in a lifetime gives 16 kg per hen lifetime.
Farmed Catfish
"Commercial Catfish" (2014): "Roughly 18 to 36 [average = 27] months is required to produce a food-sized channel catfish from an egg." 27 months is 2 years + 3 months = 2 * 365 + 3 * 30 = 820 days.
USDA (2014) reports (p. 5) an average live weight for "Foodsize or market size" catfish of 1.7 pounds.
I don't have numbers on the fraction of edible meat in catfish, so I'll fall back on an estimate for other fish. Eaglescliffe (2017):
My local fishmonger estimates that the amount of edible flesh on an average sized Atlantic Cod is around 50% of its original weight. This tallies with the view of Aliza Green, American chef and author, who writes in her book “The Fishmonger’s Apprentice” that between 45% and 50% of the caught weight of fish is edible flesh. [...]
[That said,] Rather than throw away 50% of a whole fish, the discards can be used to make a tasty fish soup or broth.
I'll take an estimate of 50% of fish live weight as edible and ignore the possibility of salvaging the discards. (1.7 pounds) * 0.5 = 0.85 pounds = 0.39 kg per catfish.
Farmed Salmon
This page says: "The life span of a standard farmed salmon ranges from 18 months to 2 years, and up to 2 to 3 years for a so-called organic salmon. By slaughter-time farm fish weigh approximately 6lb". I'll take the lifespan estimate to be the average of 18 months and 2 years: 1.75 years = 639 days.
USDA (2014), which was my source for average live weight of catfish, splits salmon into Atlantic and Pacific but doesn't report average live weight for either. So I went back to the 2005 Census of Aquaculture, which reports an average live weight for "Foodsize" salmon of 8.6 pounds (p. 5). Assuming, as with catfish, that 50% of fish live weight is edible, this gives 4.3 pounds = 2.0 kg of edible meat.
Footnotes
- This analysis counts only the suffering of the farmed fish. Importantly, it ignores the small fish that are killed to provide feed to these larger fish. (back)
- This calculation doesn't count forage fish killed to feed to chickens. In 2002, 22% of fishmeal and fish oil were fed to poultry. (back)
- This calculation doesn't count forage fish killed to feed to pigs. In 2002, 24% of fishmeal and fish oil were fed to pigs. (back)
- These numbers omit the suffering of calves. If we counted calves, the additional suffering would be at most a few times higher, especially since the raising of calves for veal or beef production offsets some consumption of beef from non-dairy cow breeds. (back)
- Actually, I personally think the pain of slaughter might represent most of the total pain of a factory-farmed chicken's life because of its intensity. However, most people think the pain of slaughter is less bad than I do, so I've tried to make the default numbers in the table a bit closer to the majority view. (back)