Calculation will finish in ~ seconds.
This piece runs several calculations over 106 time steps. Doing this takes a few seconds to complete. When you're ready, click the following button to fill in the result numbers for this page:
Changing input parameters will also recalculate results and so will freeze the page for a few seconds.a
Note: In this piece, low-ish estimates are orange, and high-ish estimates are green. I chose green to represent the lushness of the planet and not the goodness of the outcome, because a more lush planet means more suffering.
Summary
Climate change will significantly affect wild-animal populations, and hence wild-animal suffering, in the future. However, due to advances in technology, it seems unlikely climate change will have a major impact on wild-animal suffering beyond a few centuries from now. Still, there's a remote chance that human civilization will collapse before undoing climate change or eliminating the biosphere, and in that case, the effects of climate change could linger for thousands to millions of years. I calculate that this consideration might multiply the expected wild-animal impact of climate change by click the button at the top of the page to click the button at the top of the page times, although given model uncertainty and the difficulty of long-term predictions, these estimates should be taken with caution.
The default parameters in this piece suggest that the CO2 emissions of the average American lead to a long-term change of click the button at the top of the page to click the button at the top of the page expected insect-years of eventual wild-animal suffering every second. My main takeaway from this piece is that "climate change could be really important even relative to other environmental issues; we should explore further whether it's likely to increase or decrease wild-animal suffering on balance".
This piece should not be interpreted to support human technological progress or development of artificial general intelligence (AGI). Although those outcomes would probably mostly eliminate the wild-animal impacts of climate change within centuries, they would also vastly multiply suffering throughout the cosmos in other ways.
Contents
- Summary
- Introduction
- How long will climate change matter?
- Temperature impact of GHGs over time
- Wild-animal impact of warming
- Extreme-warming scenarios
- Downweighting the far future
- Putting it all together
- How many insect-years?
- Implications for family planning and economic growth
- Acknowledgments
- Footnotes
Introduction
Climate change will have important effects on wild-animal suffering, both positive and negative. I typically assume that climate change mainly matters in the next several decades, because beyond that point, either humans will undo climate change, or more radically, the dominant intelligence on Earth will transition to a digital medium and thus will be able to destroy most of the remaining biosphere.
However, there's a nonzero chance that neither of those outcomes will be realized. In scenarios where human civilization collapses and never rebuilds to a technologically advanced state, both the biosphere and the atmosphere's greenhouse-gas (GHG) emissions might remain for long periods of time. While this seems like a remote possibility, it would be very important to an overall calculation if it did happen, because the effects of climate change could last a long time.
This piece presents a crude calculation of the relative importance of short-term climate change versus unlikely scenarios of very long-term impacts on wildlife populations.
How long will climate change matter?
As of 2016, GHG emissions are still on the rise globally, and the trend will continue for years to come. But eventually technology seems likely to turn this trend around. Even if not, eventually we'll run out of economically profitable fossil fuels. In parallel, people may undertake geoengineering to reverse climate change. (Unfortunately, those forms of geoengineering that involve increasing primary productivity might increase wild-animal suffering.) Within several decades, artificial intelligence will be much more advanced than it is at present, and combined with other engineering developments, it should make addressing climate change easier.
All told, these factors point toward a view that climate change is unlikely to persist for more than, say, a century. Moreover, even if GHGs remain in the atmosphere and Earth continues to warm, the biosphere itself (and hence the animals that would be affected by climate change) may mostly disappear as AGI emerges. Most experts predict AGI within 100 years, conditional on continued scientific progress. Unless an AGI maintains human sentimental attachment to wilderness, much of the biosphere may be destroyed to provide resources to the AGI.
One class of scenarios in which these eventualities don't happen is that human progress is delayed, such as by sustained economic collapse, global nuclear winter, etc. If technological innovation mostly ceases for 100 years, then it might take 150+ years before the effects of climate change could be counteracted. Because of these possibilities, it seems prudent to use a fat-tailed probability distribution for the date at which climate change stops having significant impacts on wild animals. In particular, I'll use a lognormal distribution.
Another class of scenarios envisions a permanent collapse of humankind prior to developing AGI. This might be out-and-out extinction, but more likely it would correspond to humanity's population shrinking so small and having so few easily exploited resources (e.g., fossil fuels and surface minerals) that it failed to industrialize a second time. To account for this possibility, I include a parameter to represent the probability that significant portions of the biosphere remain on Earth for potentially millions of years. The scenarios that matter here are events like a bioengineered pandemic or nuclear war—not AGI, deliberately engineered grey goo, or very intense gamma-ray bursts, since these would destroy most animal life as well as humans. AGI and grey goo fall into the category of scenarios where the biosphere is mostly gone within a few decades.
Not all instances of human collapse would lead to very long-term impacts from climate change. For example, if humans sequester away a lot of CO2 and then later destroy themselves for a different reason, the lifetime of impact for climate change might not be very long. That said, some geoengineering measures like stratospheric sulfate aerosols would require constant effort to maintain, so if humanity collapsed, climate change would indeed continue for millennia.
There's another rather unlikely scenario in which climate change impacts might matter for a very long time: Humans develop AGI, they maintain enough sentimental attachment to Earth's biosphere that they preserve it, but they decide not to reverse climate change. I think it's unlikely advanced Earth-originating intelligence will preserve Earth's biosphere and also unlikely that if it did, it would allow climate change to continue unabated, but I include this scenario for completeness. This possibility is the bottom-right purple box in the following flow chart.
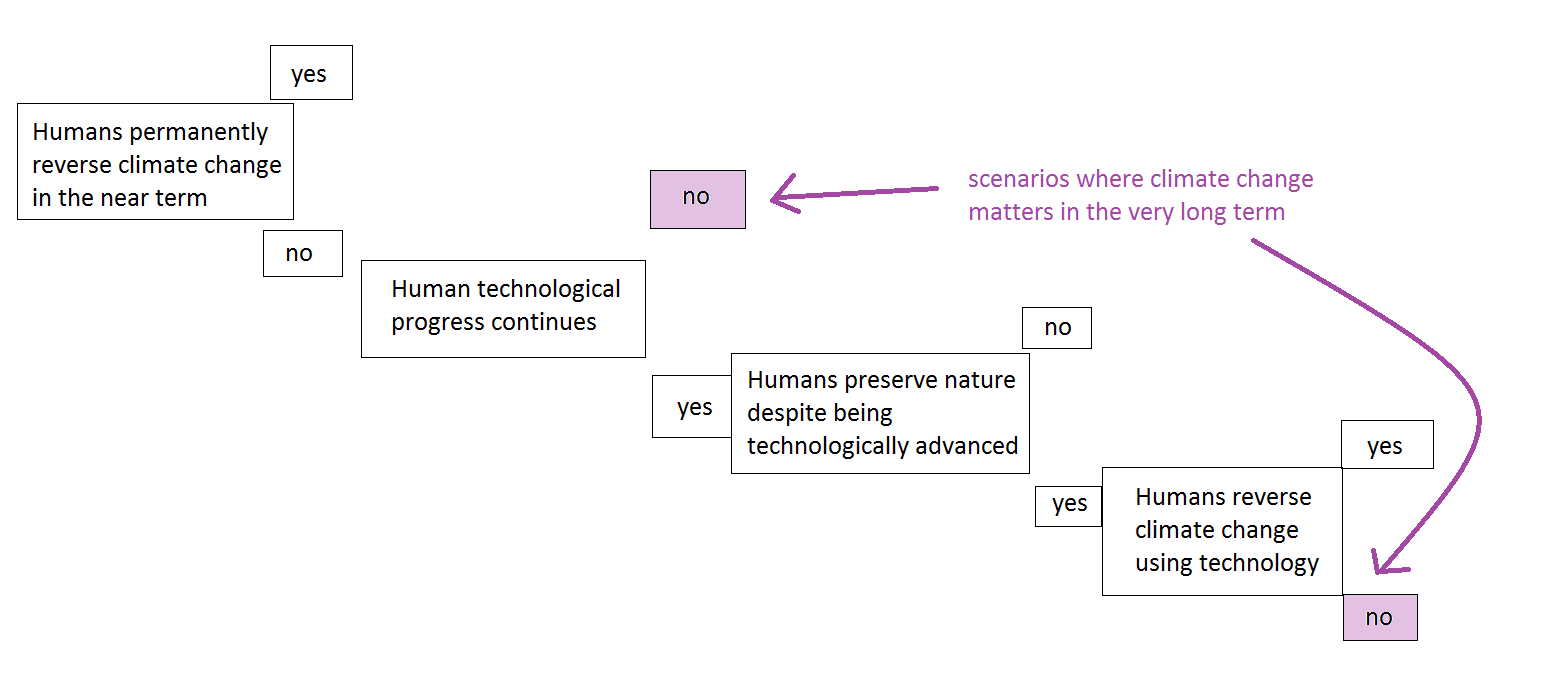
Following are parameters that allow you to toggle the probability distribution for the number T that represents how many years past 2016 climate change will remain relevant to wild-animal suffering. Of course, in reality, there won't be an exact cutoff year when climate change stops mattering (unless life on Earth is immediately destroyed by a rapid event), but you can take T to be some kind of weighted average of the the years during which climate change matters less and less for wild-animal suffering.
T is lognormally distributed with
- median eμ = years (where μ is the "location parameter" of the lognormal distribution)
- "scale parameter" σ = .
Here you can set your probability that climate change remains relevant to wild-animal suffering for millions of years (T ≥ 106): .
Temperature impact of GHGs over time
David Archer has popularized the idea that the effects of CO2 emissions may linger far longer than is ordinarily realized:
"The climatic impacts of releasing fossil fuel CO2 to the atmosphere will last longer than Stonehenge," Archer writes. "Longer than time capsules, longer than nuclear waste, far longer than the age of human civilization so far."
The effects of carbon dioxide on the atmosphere drop off so slowly that unless we kick our "fossil fuel addiction", to use George W. Bush's phrase, we could force Earth out of its regular pattern of freezes and thaws that has lasted for more than a million years. "If the entire coal reserves were used," Archer writes, "then glaciation could be delayed for half a million years."
The idea that CO2 emissions might continue to exert an impact at such long time scales has been affirmed by a few other authors. For example, this paper summarizes other studies that have also found elevated CO2 tens of thousands or even millions of years into the future:
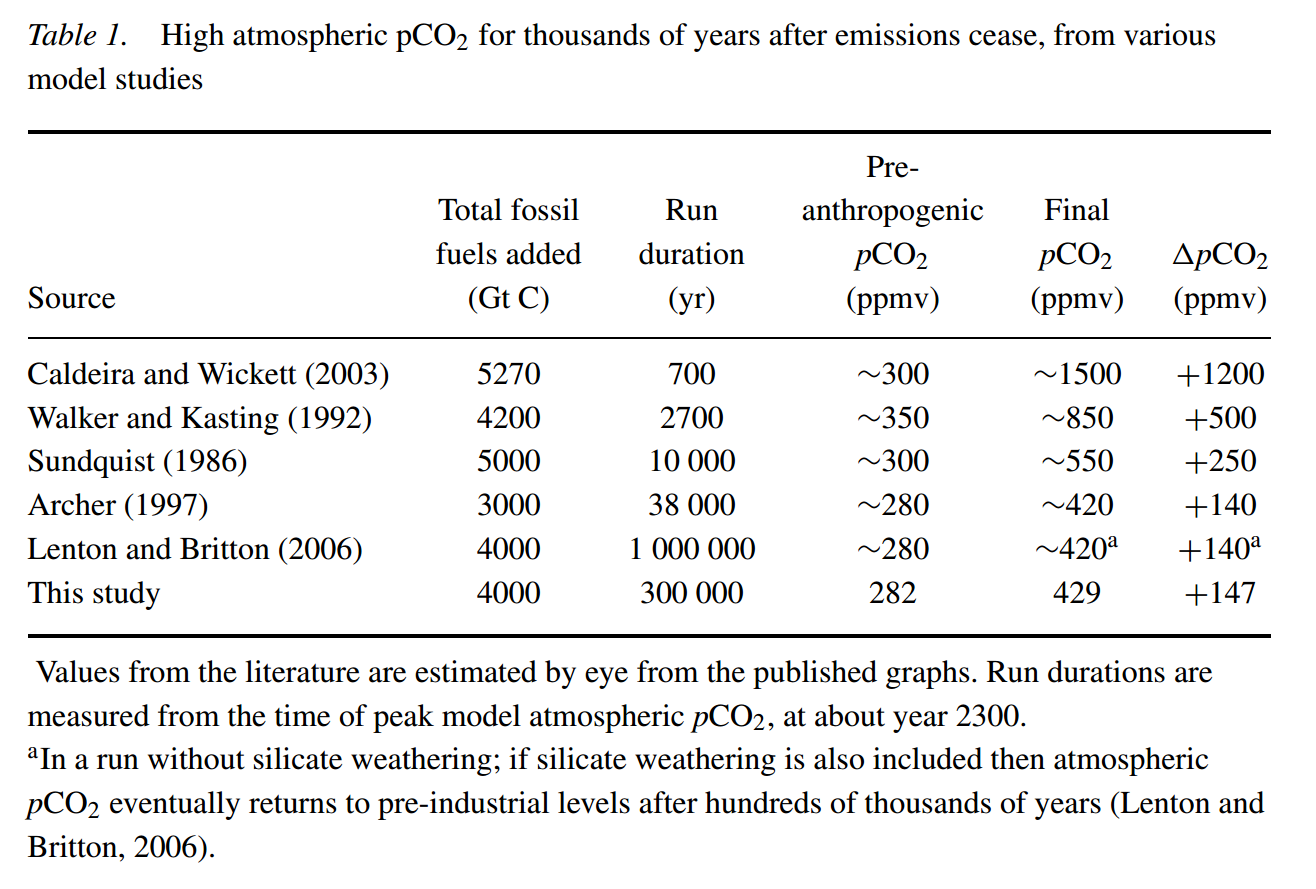
Most of these studies modeled adding ~4000 ± 1000 Gtons C to the atmosphere, which is a lot, considering that all fossil fuels constitute 4000-6000 Gtons C. Actual expected emissions in our future are probably ~2-3 times lower. But the general point that CO2 takes a long time to drop to zero may remain valid nonetheless. Moreover, some of the studies in the above table hint that impacts might persist beyond 106 years. In this piece I assume that CO2 returns to normal levels after 106 years, but this assumption may be conservative. On the other hand, given model uncertainty about whether these long-term CO2 impacts are correct, maybe assuming only 106 years of impact is a good compromise value.
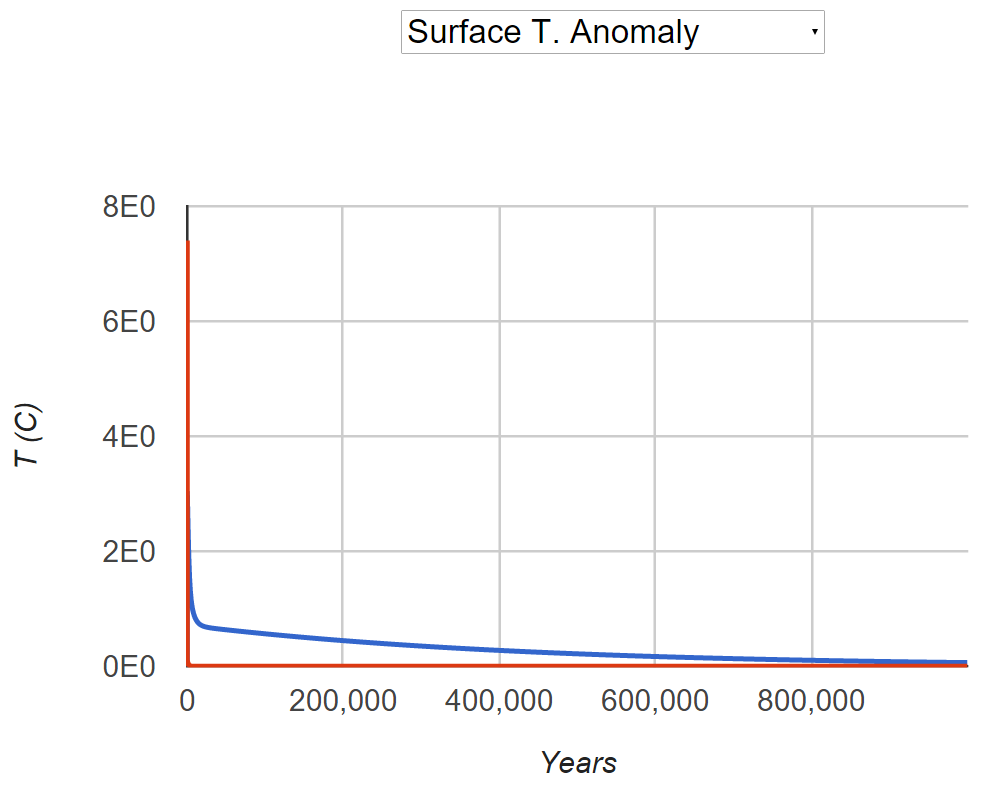
Archer has an interactive calculator for estimating the long-run impact of CO2 and methane, graphs from which are presented below.
CO2 warming
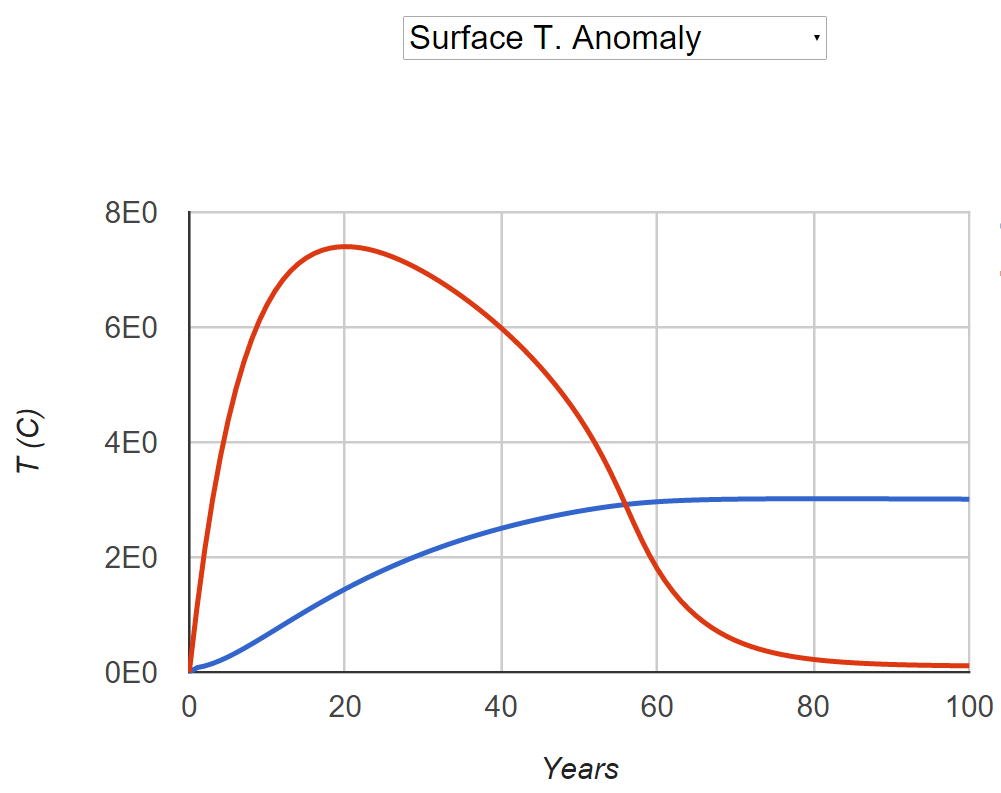
These figures show the long-term impact of a one-time emission of 1000 Gton C using Archer's default parameters.b You can ignore the methane (red) curve.
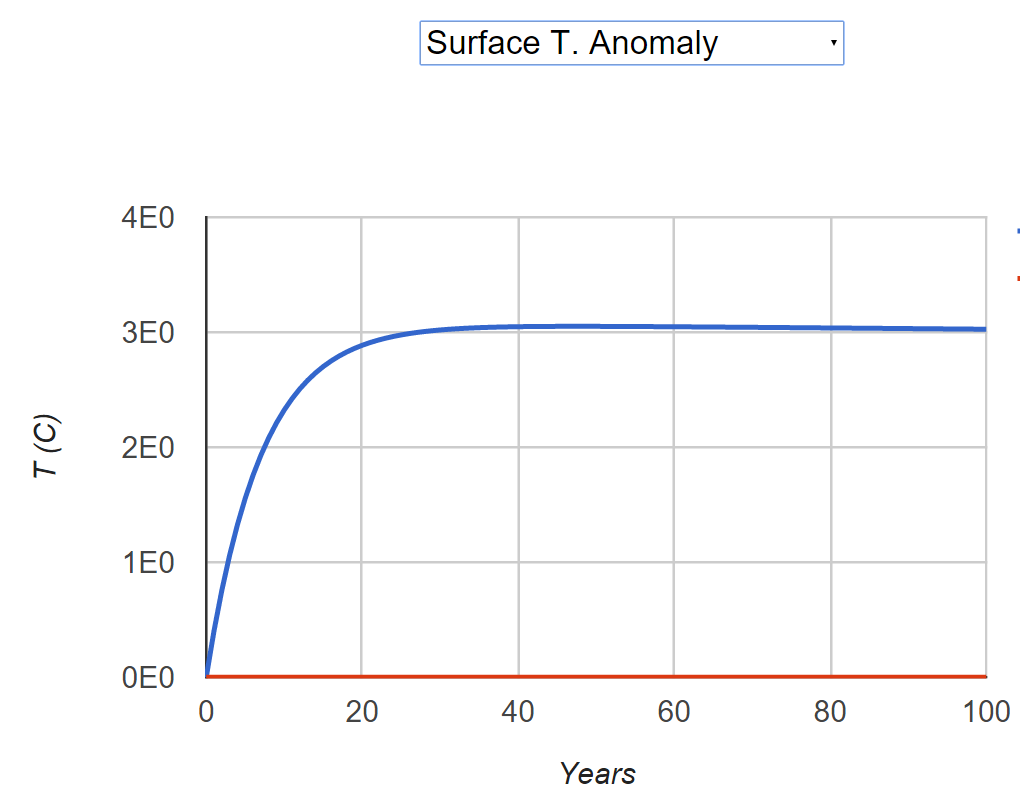
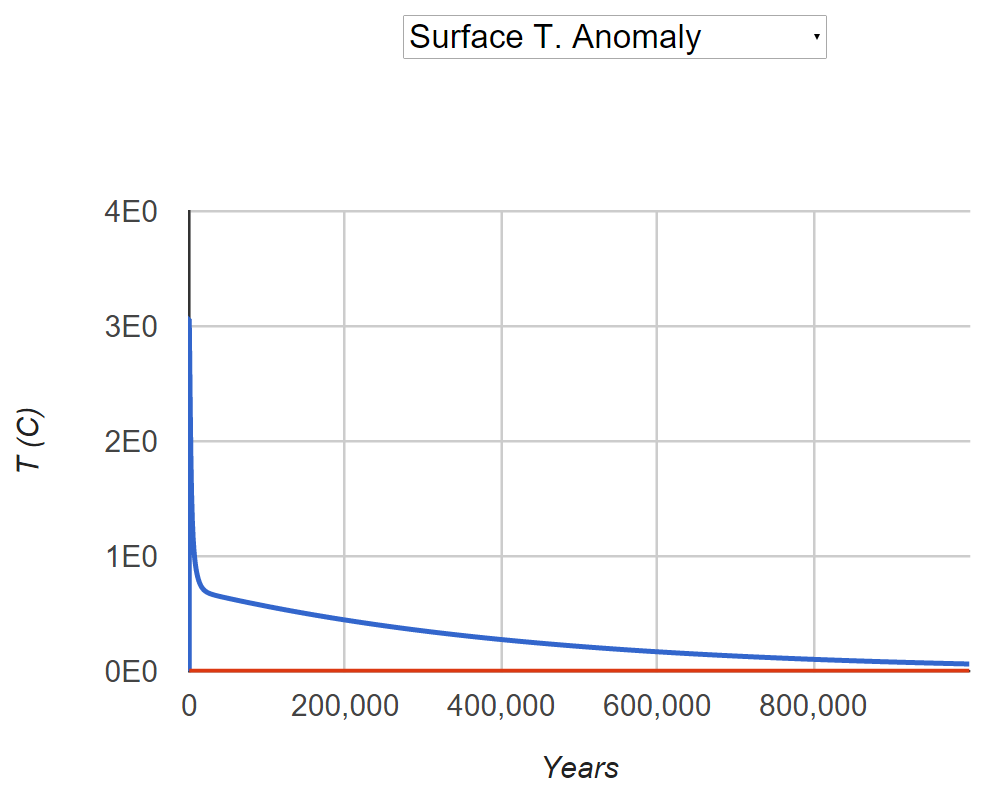
How accurate are these numbers? The peak temperature increase in the above graph is about 3°C. But this paper says 1000 Gtons C would yield roughly 2°C of warming. David Lea and Archer agree. So in order to make Archer's model output more accurate, I multiply the warming amounts in Archer's model by a fudge factor of 2/3.
Methane warming
Below is Archer's model in response to a 1000 Gton C emission of methane, with methane-caused warming in red and warming due to methane that decayed into CO2 in blue:
How much warming per metric ton?
In this piece, I discuss the warming impact of emitting one extra metric ton of CO2 or methane. This calculation is complicated by the fact that the temperature change resulting from a metric ton isn't linear: "The climate sensitivity specifically due to CO2 is often expressed as the temperature change in °C associated with a doubling of the concentration of carbon dioxide in Earth's atmosphere." That is, temperature increase is proportional to log2(CO2 concentration). This is also true in Archer's model. In particular, the following curves (based on this Google Sheet I created) show the temperature increase in Archer's model 20 years into the future from various emissions amounts:
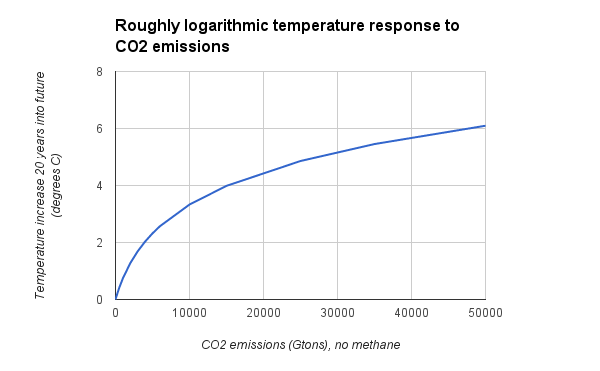
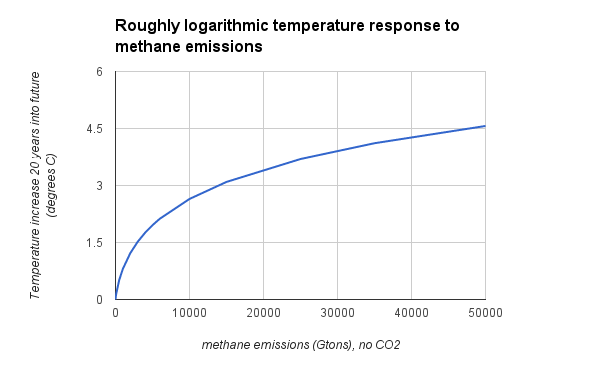
Because one extra metric ton has less impact when a lot of CO2 has already been emitted, in order to get a proper estimate of the effect of one extra metric ton of GHGs, we need to establish baseline emission amounts.
The following figure shows predictions of the four Representative Concentration Pathways from this paper:
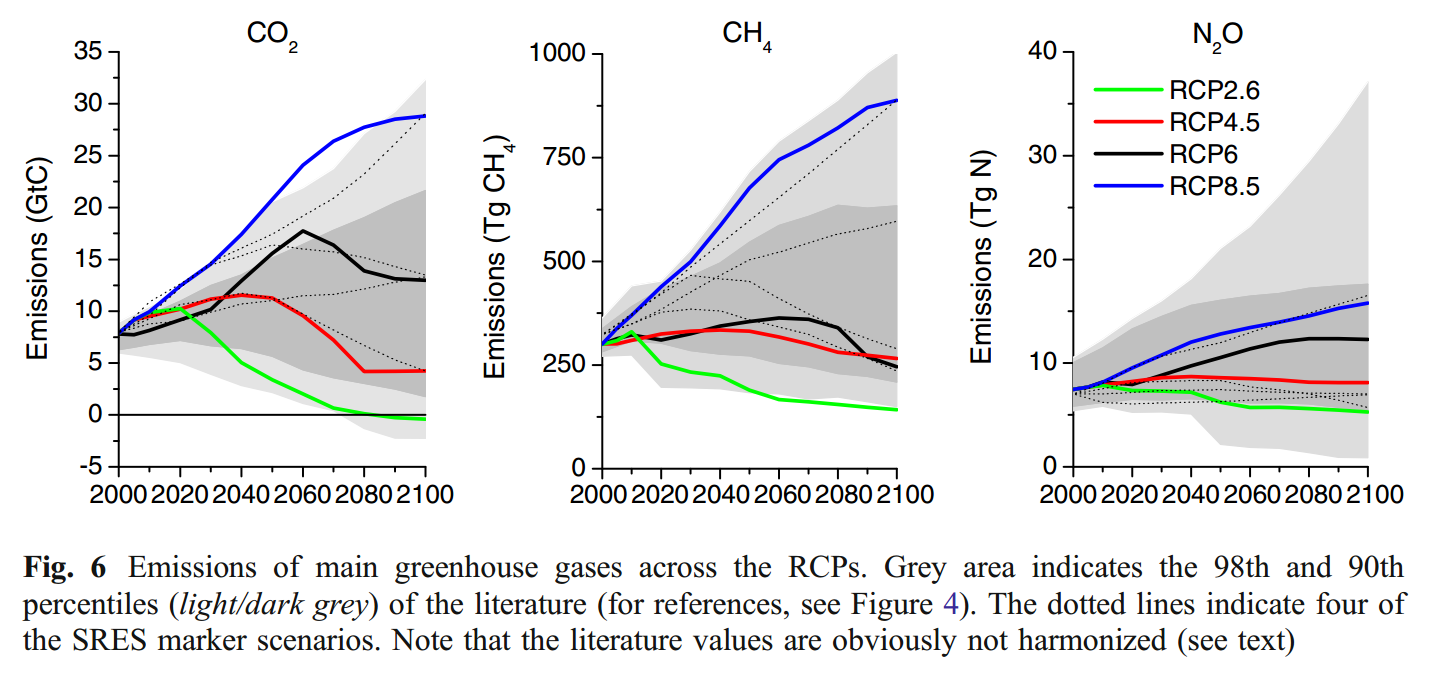
If we eyeball the average CO2 emissions as being ~12 Gtons C per year, this would imply (2100-2016)*12 = ~1000 Gtons C of future emissions by 2100. Combined with the ~600 Gtons emitted as of 2016, that implies ~1600 Gtons C by 2100. This is also roughly a middling value from Figure 4 (p. 9) of this older paper. 1600 Gtons C expressed in Gtons of CO2 is about ~.
For methane, eyeballing the graph suggests an average of ~475 Tg (which is the same as a Mton), suggesting future emissions of (2100-2016)*475 = 40 Gtons CH4. Assuming the same ratio of future to past emissions as with CO2, that implies 40 * (1600/600) = Gtons CH4. It looks from the figure like this is already measured as mass of CH4, not just mass of C.
Of course, taking the baseline emissions to be those by 2100 is not quite right. The current (e.g., as of 2016) baseline emissions amounts are smaller, implying more per-metric-ton impact for earlier emissions, and earlier emissions increase temperature for more total years within the next centuries than later emissions do (especially for long-lived CO2). On the other hand, it's also not right to just use present-day emissions amounts, because emitting more now reduces the marginal impact of later emissions. Fortunately, the results aren't particularly sensitive to the amount of baseline emissions—e.g., plugging in present-day emissions totals increases the impact of emissions within the next ~100 years by less than a factor of 2. And the impact on very long-term scenarios should be almost negligible, because what mostly matters for the very long term is how much is emitted in total, not whether it's emitted now or in 2100. For the very long-term scenarios, the baseline emissions amount should be the total emissions that will ever occur, because marginal emissions are added to that total. I approximated "total ever emissions" as "total emissions by 2100" on the assumption that 2100 is a reasonable weighted-average year by which human emissions will probably mostly stop.
Calculating marginal impact
Given those emission baselines, I calculatec the marginal impact of an additional metric ton of GHG by running Archer's model of temperature increase for (baseline emissions) + (1 metric ton) and then subtract off the temperature increase for just (baseline emissions).
Because the curve of temperature increase vs. emissions is roughly linear for small changes in emissions amounts, it's ok to multiply the impact per metric ton by a number of metric tons of emissions to approximate the total impact, as long as the number of metric tons is at least, say, ~1 order of magnitude smaller than humanity's total emissions amount.
Wild-animal impact of warming
Suppose that the expected effect that climate change has on wild-animal suffering is basically linear in the global temperature increase. This should be approximately true when the marginal temperature change caused by an additional emission of CO2 is small compared with the total temperature change, and when assessing policy choices, we're usually dealing with small changes in total emissions.
The impact of climate change may be importantly different across time. For example, in the first few decades, climate change will quickly disrupt many established ecosystems, which might cause some short-term population declines, such as of, perhaps, zooplankton. However, on the scale of millennia, it becomes more plausible that climate change will increase wild-animal populations on balance, since organisms will have had time to adapt, and the warmer temperatures may increase primary productivity, insect metabolism, and so on.
Moreover, if climate change prevents future ice ages, it would thereby dramatically increase animal populations relative to the counterfactual outcome. Ice ages drop animal populations to near zero in the regions that get iced over, and regions like tropical rainforests that are too warm to freeze might still experience productivity declines.
That said, one factor that may decrease long-run animal populations is sea-level rise: If all the world's coal were burned, it would eventually reduce the Earth's land area by 3.5%. Assuming land is more productive than open ocean and that productive estuaries/etc. would in the long run occupy roughly the same area as they did before climate change, then a reduction in land area would reduce total animal populations.
To account for the point that the expected impact of climate change may be different in the long run vs. the short run, the following table allows you to enter different numbers at different times for the net change in (sentience-weighted) wild-animal populations due to an additional 1°C of warming, expressed as a fraction of present-day wild-animal populations. For example, if you enter 0.01, this means you think that 1°C of warming will increase wild-animal populations by 1% in aggregate.d You can enter both a low-ish estimate and a high-ish estimate of these values. Currently the table's low-ish estimate is something like the 25th percentile of my probability distribution, and the high-ish estimate is something like the 75th percentile.
I added a third column to the table. It represents changes in animal populations if Earth experiences extreme warming (say, ≥ 8°C). The numbers here should probably be different than for milder warming because extreme warming may push ecosystems past their limits. For example, the "Great Dying" 252 million years ago may have been partly caused by 6°C warming, and that event saw "up to 96% of all marine species[5][6] and 70% of terrestrial vertebrate species becoming extinct.[7] It is the only known mass extinction of insects.[8][9]"
| Years from 2016 | [non-extreme warming] Aggregate animal populations will change relative to 2016 populations by this amount due to a marginal 1°C of warminge | [extreme warming] Aggregate animal populations will change relative to 2016 populations by this amount due to a marginal 1°C of warming |
|---|---|---|
| 0 to 100 | low: high: | low: high: |
| 100 to 1000 | low: high: | low: high: |
| 1000 to 10,000 | low: high: | low: high: |
| 10,000 onward | low: high: | low: high: |
Remember that these numbers are per °C of warming, so the "extreme warming" numbers imply a change in animal populations several times bigger than the "non-extreme warming" numbers when multiplied by the total degrees of warming.
One consideration that I unfortunately haven't included in this model is the possibility that humans reverse climate change via a type of geoengineering that doesn't remove CO2, such as stratospheric sulfate aerosols. Geoengineering of this sort would reduce the effects of climate change itself but would leave ocean acidification unmitigated. Prima facie, I'd guess that ocean acidification will reduce marine populations on balance. Thus, there are some scenarios where humans do reverse climate change (i.e., T < 106) but where some impacts of GHG emissions remain for a million years. Of course, I think it's most likely that AGI will destroy the oceans within centuries anyway, but the probability that AGI doesn't come along for millennia despite humans maintaining a technologically advanced civilization that has geoengineered its way out of climate change doesn't seem lower than, say, ~5%.
Extreme-warming scenarios
Naively we might think that since extreme warming is unlikely, it shouldn't factor heavily in our calculations. However, extreme warming is correlated with scenarios where humanity doesn't become technologically super-advanced, either because extreme warming directly degrades humanity's economic productivity or, more likely, because it triggers conflict that leads to nuclear war and other more lethal short-term consequences. Hence, the contribution of extreme-warming scenarios to the overall calculation may not be trivial.
There aren't good estimates of the likelihood of extreme warming. Martin Weitzman calculates an extremely crude estimate that P(warming > 10°C) ≈ 0.05 and P(warming > 20°C) ≈ 0.01. I personally think these estimates are a bit too high, because I suspect that if warming got really bad, humans would eventually limit GHGs. (And if a country didn't cooperatively agree to GHG cuts, it could be coerced economically or militarily into doing so.) Weitzman acknowledges this point but says "the extraordinarily long inertial lags in the commitment pipeline converting GHG emissions into temperature increases might severely limit this option" (p. 4). Even if long time lags are an issue, it's quite plausible that geoengineering of some form would allow for either removing GHGs or otherwise cooling the planet on a time scale of decades. If the matter was important, countries might be willing to pay high prices for geoengineering solutions.
So I think P(warming > 10°C) should be more like, say, 0.01. But since I defined "extreme" warming as ≥8°C, a slightly higher probability seems warranted—say .
Next, I want to calculate P(extreme warming) conditional on whether humans achieve a technologically advanced state (T < 106) or not (T ≥ 106). First, I'll calculate P(extreme warming | T < 106). The scenarios where T < 106 can be basically partitioned into two types:
- Those where AGI comes along and either undoes climate change or otherwise eliminates most biological wildlife. Call this scenario "AGI". In this scenario, extreme warming could continue if the AGI didn't care to stop it, perhaps because the AGI no longer depended on the biosphere.
- Those where AGI fails to materialize but humans nonetheless reverse climate change. Call this scenario "RevCC". In this case, extreme climate change would not occur because humanity would stop it.
Then
P(extreme warming | T < 106) = P(AGI | T < 106) * P(extreme warming | AGI) + P(RevCC | T < 106) * P(extreme warming | RevCC) = * + (1 - click the button at the top of the page) * = click the button at the top of the page.
Recall that earlier in this piece, you set P(T ≥ 106) at click the button at the top of the page. By Bayes' theorem:
P(T < 106 | extreme warming) = P(extreme warming | T < 106) * P(T < 106) / P(extreme warming) = (click the button at the top of the page) * (1 - click the button at the top of the page) / click the button at the top of the page = click the button at the top of the page.
In the next calculation, we remember that P(T ≥ 106 | extreme warming) = 1 - P(T < 106 | extreme warming):
P(extreme warming | T ≥ 106) = P(T ≥ 106 | extreme warming) * P(extreme warming) / P(T ≥ 106) = (1 - click the button at the top of the page) * click the button at the top of the page / click the button at the top of the page = click the button at the top of the page.
This number seems pretty reasonable. For example, if I imagine scenarios where T ≥ 106, some candidate reasons for society's permanent collapse include extreme climate change, virulent engineered pandemic, nuclear winter, and permanent economic meltdown for other reasons. It seems plausible to suggest that ~1/3 of T ≥ 106 outcomes might be driven by extreme climate change.
Downweighting the far future
Most arguments for the possibility that we might have huge impacts on the far future postulate that our impact would come through influencing human society, such as by affecting how AGI is developed. But human society is very complex and hard to predict. In contrast, predicting the long-term future of climate change in a world without technologically advanced civilization is a relatively more certain matter of Earth science and climate modeling. Of course, the climate also has complex and unpredictable feedback loops, but at least from the geologic record, we can get a reasonable degree of certainty about future trends. For this reason, I think there's plausibly orders of magnitude less uncertainty about our ability to influence very long-term effects of climate change than there is about our ability to influence galaxy-sized computations of a future AGI.
However, there is still at least one important reason why we might discount far-future climate change impacts even if human civilization collapses. If we're in a computer simulation focused on the technological rise of humanity run for reasons of science or intrinsic value, then if humans go extinct or otherwise fail to re-build civilization following a collapse, the simulators might shut off the simulation, in which case the long-term future of wilderness would not be computed. Fortunately, in some simulation scenarios, the suffering of remote wild animals out of contact with humans would not be simulated in much detail even at present. Alas, those simulations demanding high-fidelity predictive power would need to simulate wild-animal suffering.
Even if our simulators are not studying human development specifically but merely evolution in general, there's always a higher probability of the simulation being shut off further in the future from now, because any simulation is only run for so long. This simulation argument downweights the importance of wild-animal suffering many millennia from now. Whether it only downweights it a little or whether it renders future suffering much less important depends on your beliefs about the distribution of simulation scenarios.
To account for greater uncertainty about whether animals will exist further in the future—as well as uncertainty about the climate predictions made by Archer's model further in the future—I'll discount wild animals t years into the future by a probabilistic factor tk for k in (‑∞, 0]. To avoid having this curve explode near t = 0, I cap the value of this discount at 1 for t < 1. I choose k = , which implies the following discounting curve:
Putting it all together
Combining the previous sections gives us all the inputs needed to compute the total expected impact of CO2 emissions:
total expected impact per metric ton CO2 emitted = [ ∫0106 (probability density function of T at t) * (long-run change in aggregate wild-animal populations if T = t) dt ] + [ P(T ≥ 106) * (long-run change in aggregate wild-animal populations if T ≥ 106) ],
where
(long-run change in aggregate wild-animal populations if T = t) = P(non-extreme warming | t) * (long-run change in aggregate wild-animal populations if T = t | non-extreme warming) + P(extreme warming | t) * (long-run change in aggregate wild-animal populations if T = t | extreme warming)
and
(long-run change in aggregate wild-animal populations if T = t | warming extremeness) = ∫0t (temperature increase at year τ due to emissions | warming extremeness) * (change in aggregate populations per °C at year τ | warming extremeness) * (probability discount at year τ) dτ ,
and it's assumed that there's no lingering CO2 impact after 106 years.f The units of the final equation above are years / Gton CO2 = (°C / Gton CO2) * (1 / °C) * (1) * year.
For temperature increase given extreme warming, I multiply the numbers from Archer's model by a factor of 10/3 = , based on the hacky assumption that a prototypical extreme-warming amount is 10°C, while a prototypical non-extreme amount is 3°C.
The result of the calculation, done using numerical integration with the rectangle method based on 10 uniformly spaced time steps, is click the button at the top of the page to click the button at the top of the page. Note that if you ignored the possibility of the biosphere remaining for a long time—i.e., if you set P(T ≥ 106) = 0—the result would be much smaller in absolute value: click the button at the top of the page to click the button at the top of the page.
Using analogous calculations for methane, we get click the button at the top of the page to click the button at the top of the page as the total impact and click the button at the top of the page to click the button at the top of the page as the impact if P(T ≥ 106) = 0.
How many insect-years?
The above calculations give multipliers on the present-day animal population. To make them tangible, we can think about actual numbers of wild animals. I'll focus just on insects. Suppose there are 10 insects on Earth. If we measure insect suffering in the unit "insect-years", then there are 10click the button at the top of the page insect-years per year on Earth. Multiplying this by click the button at the top of the page to click the button at the top of the page years / Gton CO2 from before and converting from Gtons to just tons gives click the button at the top of the page to click the button at the top of the page insect-years of suffering per ton of CO2. The average American emits tons of CO2 per year (not counting other GHGs or land-use changes) and this creates, in expectation, click the button at the top of the page to click the button at the top of the page insect-years of suffering per year, which is click the button at the top of the page to click the button at the top of the page per second!
The following table shows the insect impact of various CO2-producing activitiesg:
| Activity | kg CO2 released | Low-ish estimate of change in insect-years | High-ish estimate of change in insect-years |
| using a 60W-equivalent LED light for 5 hours | click the button at the top of the page | click the button at the top of the page | |
| buying a banana | click the button at the top of the page | click the button at the top of the page | |
| using a 60W-equivalent incandescent light for 5 hours | click the button at the top of the page | click the button at the top of the page | |
| using a 75W laptop for 5 hours | h | click the button at the top of the page | click the button at the top of the page |
| showering 5 minutes using hot water with a showerhead of 10 liters per minute | click the button at the top of the page | click the button at the top of the page | |
| using 1 gallon of gas driving | click the button at the top of the page | click the button at the top of the page | |
| round-trip flight NY to San Franscisco |
These calculations assume that your personally producing an extra kg of CO2 creates an extra kg of CO2 in total. This may not be exactly true because your buying energy or airplane tickets slightly increases the price, which slightly reduces the amount that other people use. But that's unlikely to change the results by more than a factor of ~2 assuming typical supply and demand elasticities.
What should we make of carbon offsets? For now, their impact is very unclear, given that we don't know if preventing climate change is bad or good for wild animals on balance. In addition, we should avoid buying biomass-based carbon offsets, such as those involving rainforest preservation or rewilding, because these probably cause more suffering via creating animal habitat than they may (or may not) prevent. Worryingly, even non-biomass-based offsets might support offset-providing organizations in general, which could increase use of biomass-based offsets by other people.
Possibly donations to energy efficiency, renewable energy, and research on future energy sources like fusion would have comparable or greater bang per buck than carbon offsets anyway. For example, following are some plausible made-up numbers to illustrate:
- Say (non-habitat-preservation!) carbon offsets cost ~$10 per metric ton of CO2 removed on the margin.
- Imagine that $36 billion spent on energy efficiency could reduce world emissions (~36 billion metric tons per year) by 1% for 10 years, saving 3.6 billion metric tons of emissions. This would also imply a cost of $10 per metric ton.
- Suppose that an extra $18 billion spent on fusion research would have a 1% chancei of bringing fusion forward in time by 10 years, and doing so would replace 50% of global emissions per year. (For reference, the US currently spends about $0.5 billion on fusion research per year.) Then the cost per metric ton of CO2 prevented would be ($18 billion) / [0.01 * 0.5 * (36 billion metric tons / year) * (10 years)] = $10 per metric ton.
Assuming $ to prevent a metric ton of CO2, donating toward such efforts would, on the margin, cause a change of click the button at the top of the page to click the button at the top of the page insect-years of suffering. (Here, the order of the green vs. yellow colors is reversed relative to everywhere else in this piece because I'm discussing an intervention to reduce the effects of climate change. If climate change tends to increase suffering, this intervention tends to reduce suffering, and vice versa.)
In any event, these interventions would be premature before first researching in greater depth whether climate change is good news or bad news for wild animals. Right now I find it about as plausible that CO2 reduction would harm wild animals as that it would help them.
Implications for family planning and economic growth
If climate change is more important in expectation than we naively thought, this has implications for questions about the size and resource consumption of the human population. Ordinarily I tend to assume that a larger human population, ceteris paribus, would reduce wild-animal suffering, since both vertebrate and invertebrate animal populations have declined by almost half in the last few decades (or maybe somewhat less if, like I am, you're wary of reporting bias for the most extreme findings). However, with the possibility of long-term climate change thrown into the mix, the analysis becomes murkier.
Suppose that humanity as a whole reduces current wild-animal populations by ~50%, from N insect-years per year to N/2. Assuming the biosphere will exist for ~100 years into the future, that implies a reduction of ~0.5N * 100 = 50N.
If we ignore very long-term climate impacts, then assuming as above that humans will emit click the button at the top of the page Gtons CO2 by 2100, climate change would produce an expected click the button at the top of the page * (click the button at the top of the page) * N/2 = click the button at the top of the pageN change in wild-animal suffering as a low estimate and an expected click the button at the top of the pageN change as a high estimate (where I'm multiplying by N/2 rather than N on the assumption that human activities have reduced wild-animal populations to N/2).j This is small compared with 50N.
However, if we count the possibility of climate impacts many thousands of years into the future, the expected change in wild-animal populations from climate change is click the button at the top of the page * (click the button at the top of the page) * N = click the button at the top of the pageN as a low estimate and click the button at the top of the pageN as a high estimate, which (using my default parameters) are in a similar ballpark as the 50N reduction from human activity. (Here I'm multiplying by N rather than N/2 because if the biosphere does exist hundreds of thousands of years from now, it probably won't be significantly degraded by humans, and most of the impact under consideration here comes from scenarios where the biosphere does exist in the long run.)
This casts into some doubt the net impact of present-day human activity for wild-animal suffering. Correspondingly, it renders the sign of net impact of family planning, poverty reduction, and economic growth less clear.k Of course, if we approximate the expected impact of climate change as about neutral pending further investigation, then climate change doesn't affect the expected value of economic growth and such, just the variance.
Of course, one could try to argue that habitat destruction and other human activities that are reducing wild-animal populations in the present could persist for a million years to come. But this seems implausible in most cases. Even pavement will degrade within decades, as readers of the end of The Wump World know. I suppose some regions of the planet will become desert, and the oceans will acidify, but these developments are in large part driven by GHG emissions. It's hard to identify non-climate anthropogenic factors that will non-trivially and predictably change aggregate wild-animal populations a million years from now assuming human civilization collapses prior to developing AGI, grey goo, etc.
Acknowledgments
Joe Turco pointed out to me the relevance of the Permian–Triassic extinction event to this analysis.
Footnotes
- Don't re-enter parameter values while an existing calculation is running because this might interleave the outputs. (back)
- In this piece, I focus on "surface temperature anomaly" rather than "equilibrium temperature", which is another output of Archer's calculator. As best I can tell from Archer's code and discussions like this, surface temperature anomaly represents the actual temperature at a given time, while equilibrium temperature is the value that the atmosphere converges toward. (back)
- I got the source JavaScript for Archer's model from his calculator web page and then stripped it down to the bare essentials for my purposes, converting 417 lines of code to 69. I also renamed variables and moved things around to enhance clarity, while verifying that the model's temperature-change output stayed the same as before to all decimal places. You can see the model's code by viewing the JavaScript for this page and searching
get_years_and_surface_warming_amounts. (back) - Actually, you should enter the net change in insect-years of suffering per year regardless of whether it's due to population or otherwise, but as a crude approximation, most changes in suffering are due to changes in population. One example of how climate change might increase suffering without increasing population is that warmer temperatures may favor shorter organism lifespans, implying more painful deaths per unit time. (back)
- In calculus terms, this quantity can be expressed as follows. Let pop2016 be the 2016 world population of wild animals. Let temp be temperature. Then the numbers in this table are (∂pop / ∂temp) / pop2016 evaluated at the baseline future temperature. (back)
- I tried going out to 3 * 106 years, and the impact was at most 5-10% more than what's reported here. However, doing a longer time period made computations take ~3 times longer, and doing more than ~3 * 106 years led the page to crash. (back)
- Some of the below numbers are based on CO2-equivalent GHGs, not pure CO2. For simplicity, I assume that CO2-equivalent GHGs can just be considered CO2, since probably the contribution of other GHGs is small. This is slightly inaccurate because the CO2-equivalent conversion factors typically used don't correspond to those that apply over a 106 time scale. :) (back)
- For this calculation, I assume the same CO2-per-kWh value as for lightbulbs: 0.554 kg CO2(e)/kWh. So 75W * 5 h * (1 kWh / 1000 Wh) * (0.554 kg CO2 / kWh) = 0.21 kg CO2. (back)
- This is a high-risk gamble, but assuming the marginal warming and animal impacts of emissions are basically linear, then the expected benefit or cost of reducing emissions should also be roughly linear. Given that global warming is in fact slightly nonlinear with respect to emissions amounts, some degree of risk aversion or risk seeking might be warranted. (back)
- Note that this number is somewhat too low because I'm just multiplying click the button at the top of the page by the marginal impact of an additional Gton of CO2, ignoring the fact that a given increase in CO2 has more radiative-forcing impact at lower CO2 concentrations. (back)
- Here I'm just talking about the impact on terrestrial biological wild animals. Of course, economic growth and such also have many effects, both positive and negative, on far-future suffering. (back)