Summary
This page presents estimates of (metazoan) zooplankton densities in rivers. Densities vary widely but are generally between ~101 and ~103 individuals per liter, with most zooplankton being rotifers.
Contents
General background
Plankton living in rivers are called "potamoplankton".
This study says (p. 49):
Confirming earliest river concepts such as the River Continuum Concept (Vannote et al., 1980) a downstream directed plankton development has been observed in many larger rivers (De Ruyter van Steveninck et al., 1992; Meister, 1994; Viroux, 1997, 2002; Kim & Joo, 2000).
This paper says (p. 1488):
Net primary productivity in rivers is limited in part by the amount of time phytoplankton are swept below the photic zone by the helical, downstream circulation patterns of rivers and by the amount of bottom surface area available for benthic microalgal production. At least the former influences riverine zooplankton production (Pace et al., 1992).
Relevance of slow waters
This textbook says:
Phytoplankton and zooplankton are minor components of undisturbed lotic [i.e., river] ecosystems. This is not the case where the currents are much reduced by dams or locks, such as on the Mississippi, the Thames in England, or the Dnieper in the Republic of Russia. Here, true phytoplankton occur because the residence time of the water is longer than the time required for cell division [...].
This study says (pp. 1060-61):
The dynamics of river zooplankton are often considered to be controlled by transport of populations (Hynes 1970). Recent studies confirm this view while also documenting significant population growth during transport (Saunders and Lewis 1989). In addition, other factors such as turbidity and food may regulate zooplankton in rivers. High concentrations of suspended organic and inorganic particles can have negative effects on the ingestion, growth, and reproduction of certain zooplankton (Arruda et al. 1983; McCabe and O'Brien 1983; Threlkeld 1986; Hart 1987, 1988; Kirk and Gilbert 1990). Further, although phytoplankton and bacteria may be abundant in rivers, a substantial portion of these resources may be either inedible, toxic, or poor-quality food (Arruda et al. 1983; Pace et al. 1983; Fulton and Pearl 1987; Hart 1988).
[...] In the upper reaches of most rivers, downstream advection is so rapid that planktonic populations cannot develop (Hynes 1970). In downstream reaches or in tidal portions, positive population growth is possible due to greater water residence time.
This paper adds (p. 1163):
The lack of research on potamoplankton may have resulted from the opinion that rivers were not suitable environments for zooplankton. However, potamoplankton is usually abundant in the main channel of large rivers, although the factors regulating their spatial occurrence are not completely understood. Recent investigation has emphasized the importance of water residence time for zooplankton development (Basu & Pick 1996). Water residence time increases with the increasing river length and there is often a tendency for plankton to be more abundant downstream. Generally these downstream increases have been associated with the increases of time available for plankton to develop (Viroux 1999; Zimmermann-Timm et al. 2007).
Dominance by rotifers
This paper says (p. 1486): "Rotifers are typically the most abundant zooplankton in rivers (e.g. Pace, Findlay & Lints, 1992; Thorp et al., 1994; Kobayashi et al., 1996; Kim & Joo, 2000)".
This paper agrees (p. 1168):
The zooplankton community of the lower Vistula River is dominated by rotifers [...]. Similar domination of rotifers was observed in several rivers including the Elbe (Zimmermann-Timm et al. 2007), the Danube (Reckendorfer et al. 1999), the Loire (Lair & Reyes-Marchant 1997), the Rhine (Friedrich & Pohlmann 2009), the Po (Rossetti et al. 2009) and the Darling (Shiel 1985). It has been suggested that the apparent dominance of rotifers in rivers maybe due to their relatively short generation times compared to the larger crustacean zooplankton (van Dijk & van Zanten 1995; Lair 2006). Furthermore, Pourriot et al. (1997) reports that small rotifers are eliminated to a lesser extend by the preying fish. Simply, rotifers are better adapted to the adverse conditions of lotic habitats than crustacean species (Marneffe et al. 1996; Demetraki- Paleolog 2004).
Orsi and Mecum (1986)
Orsi and Mecum (1986) examined zooplankton in the Sacramento-San Joaquin delta. In their "Introduction", they explain:
The large inland delta of the Sacramento and San Joaquin rivers in central California is estuarine in that it is tidal, but salinity intrusion is usually limited to its western extension during periods of low river flow. High densities of freshwater crustaceans occur in some channels, but other channels have sparse populations in spite of negligible salinity levels (Turner 1966a).
Sampling was done using "Ten minute oblique bottom-to-surface tows" (p. 327), so I think the densities reported in this study are representative of densities throughout the river water column, not just at the surface? (In contrast, some other studies summarized on this page sampled just from near the surface.)
In the section "Freshwater Zooplankton Abundance Patterns" (p. 332), the authors report:
Rotifers were the most abundant group with densities of 104-105 m-3 [i.e., 10 to 100 per liter]. Cladocerans were next most abundant at 102-104 m-3 [i.e., 0.1 to 10 per liter] and adult copepods were least abundant with densities generally < 103 m-3 [i.e., < 1 per liter] (Fig. 11).
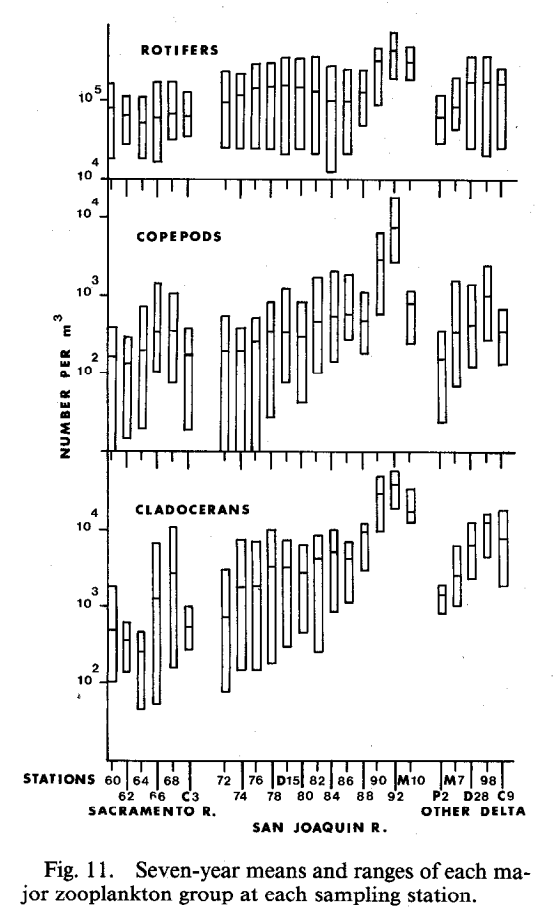
However, the above densities have a big asterisk regarding copepods. These numbers are abundances of freshwater zooplankton. But the rivers sometimes also contained brackish-water zooplankton, including the copepod Eurytemora affinis (p. 331). E. afinis "was found throughout most of the delta in all years. It became progressively less abundant moving upstream" (p. 331). Because of the presence of E. afinis, "the early life stages of copepods (the nauplii and copepodids) could not be included in the total number of freshwater copepods" (p. 332). I don't think the authors explained why this was the case, but I assume it's because the earlier life stages are hard to distinguish from one another, so it wasn't possible to tell which nauplii and copepodids were from freshwater species and which were from brackish species. The authors further explained regarding this problem (p. 332):
This biased copepod abundance relative to the other groups of zooplankton for which juveniles as well as adults were counted. To clarify the abundance of copepods relative to other zooplankton, abundance of early life stages at Stockton and Hood (where E. afinis was never or rarely found) was calculated for each year. At both stations the total abundance of all life stages of copepods was greater than cladoceran abundance and lower than rotifer abundance (Table 1). It is reasonable to infer that this relationship held true over the entire delta.
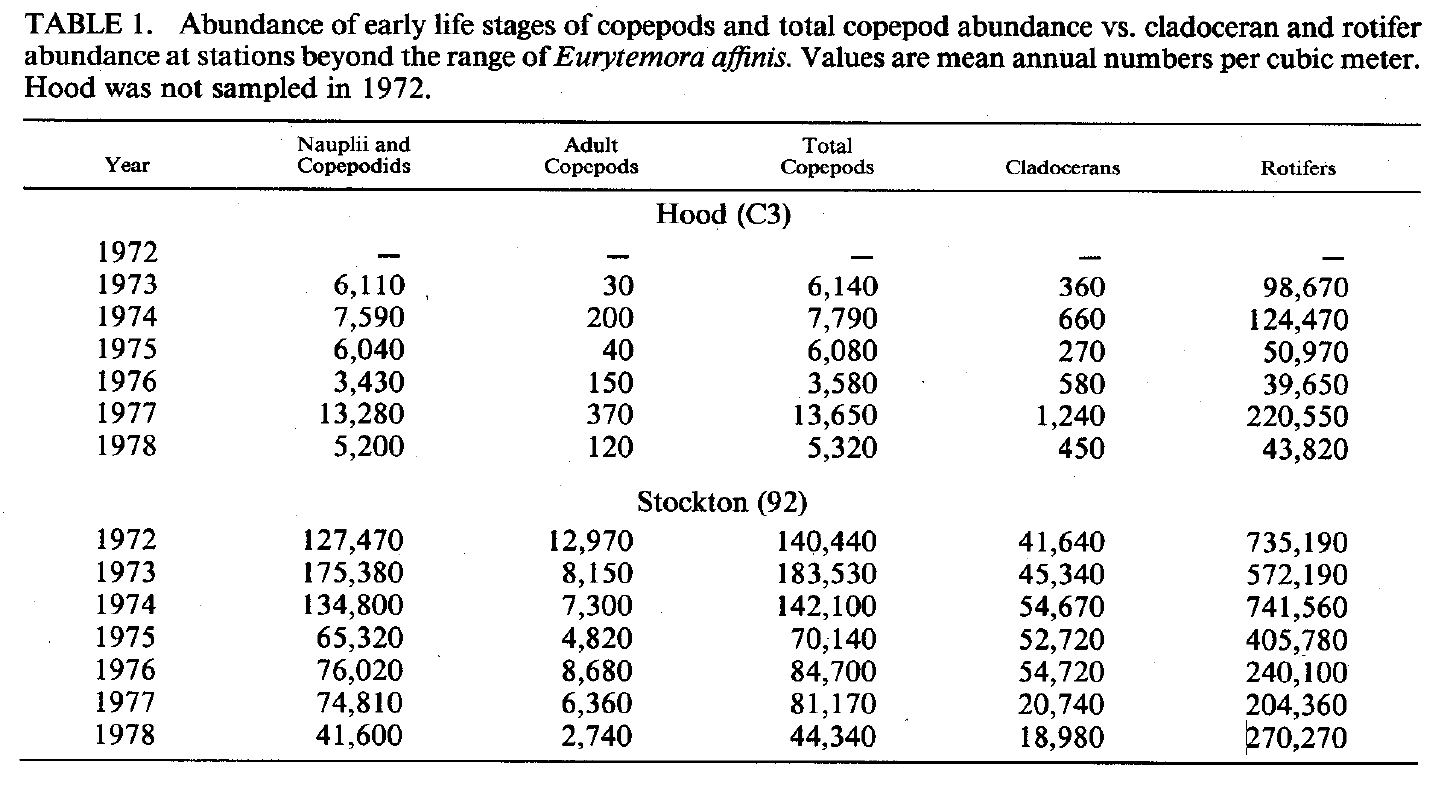
It's interesting (and sad) to note how much more abundant early copepod life stages are than adults. Presumably this reflects high early mortality. One might think that an alternate explanation could be that young are just more abundant at this time of year. However, that seems unlikely to me because these numbers are averages over a long sampling period: "March-November means" (p. 335, caption of Table 3).
Pace et al. (1992)
Pace et al. (1992) examined "zooplankton in the tidal freshwater portion of the Hudson River" in New York, USA (p. 1060). The "study region was [...] primarily the freshwater section of the estuary except in late summer when the oligohaline portion was also included in the studies of spatial distribution" (p. 1062).
As far as sampling depth (p. 1062):
Zooplankton were sampled at 0.5 m depth with an open diaphragm bilge pump. Because the river is uniformly mixed, a sample from a single depth is sufficient to characterize the water column (Findlay et al. 199la, 199lb).
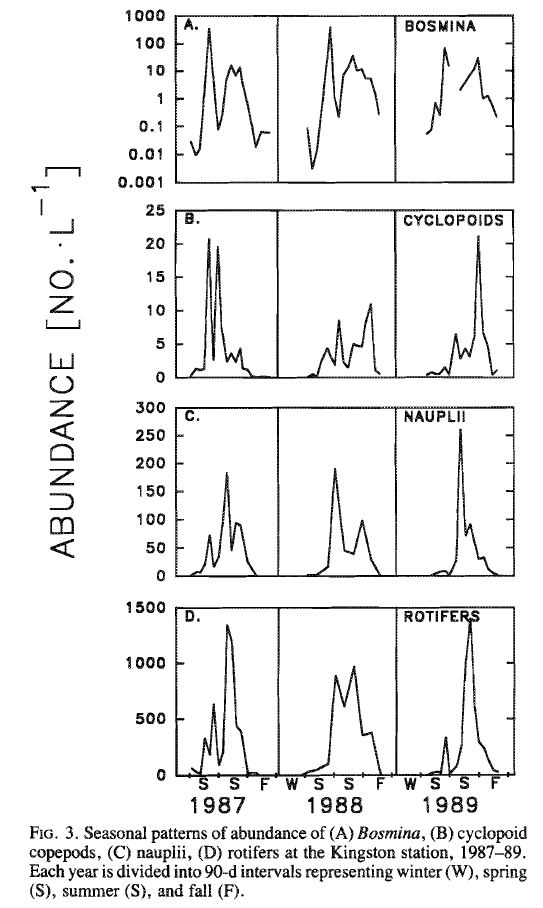
The authors found the following abundances (p. 1064):
The authors also conducted a literature search for other studies in order to compare zooplankton biomass densities. They produced the following summary figure, where the "Hudson" triangles are the numbers measured by Pace et al. (1992) themselves:
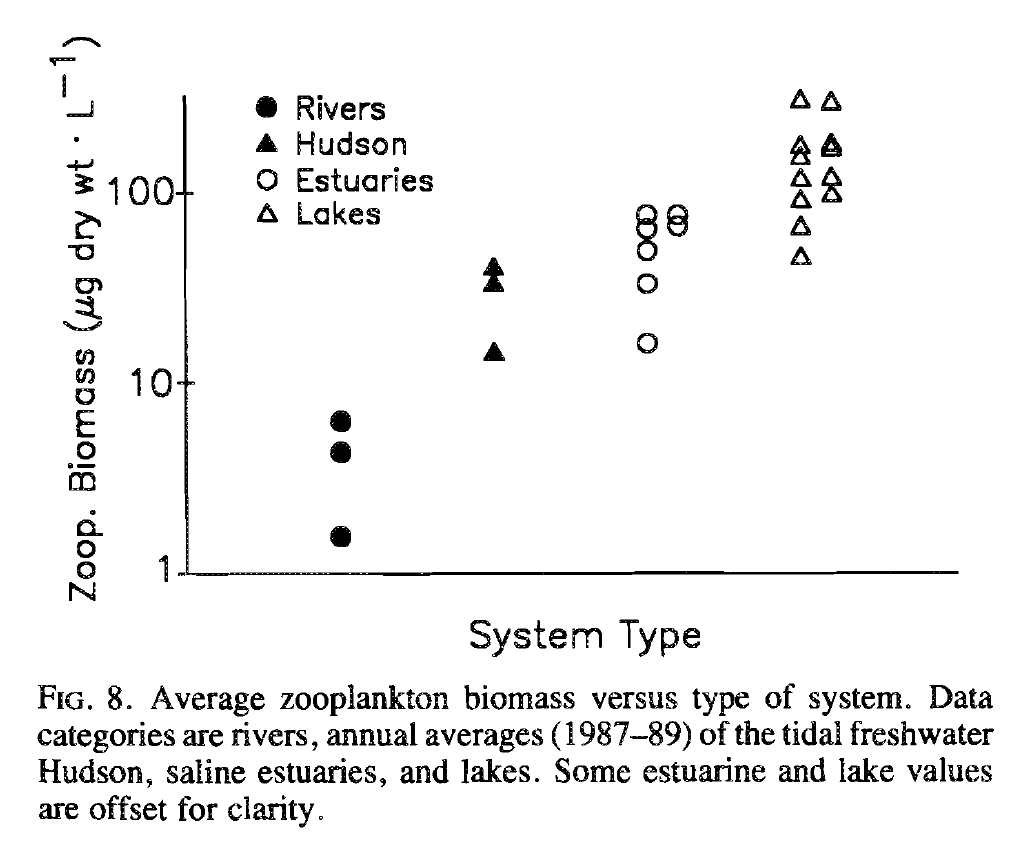
The "Lakes" data points include some lakes that "were oligotrophic with low concentrations of nutrients and chlorophyll (Pace 1986)" (p. 1065).
I would guess that one reason river biomass is lower may be that, in rivers (p. 1068):
zooplankton community size structure appears to be more uniformly dominated by small species than is the case in lakes (Shiel et al. 1982). A number of factors probably favor small zooplankton in rivers. Small species have short generation times which could reduce the impact of advective losses. Small species feed and grow more successfully than large species when high concentrations of filamentous and/or toxic algae are present (Webster and Peters 1978; Fulton and Pearl 1987; Fulton 1988; Gilbert 1990), as is often the case in rivers (Hynes 1970) including the Hudson, where high densities of filamentous and gelatinous blue-greens occur (Marshall 1988). Finally, small species may be favored in turbid environments.
Thorp and Mantovani (2005)
Locations
Thorp and Mantovani (2005) sampled prairie rivers in the USA at the locations shown as asterisks in the following map:
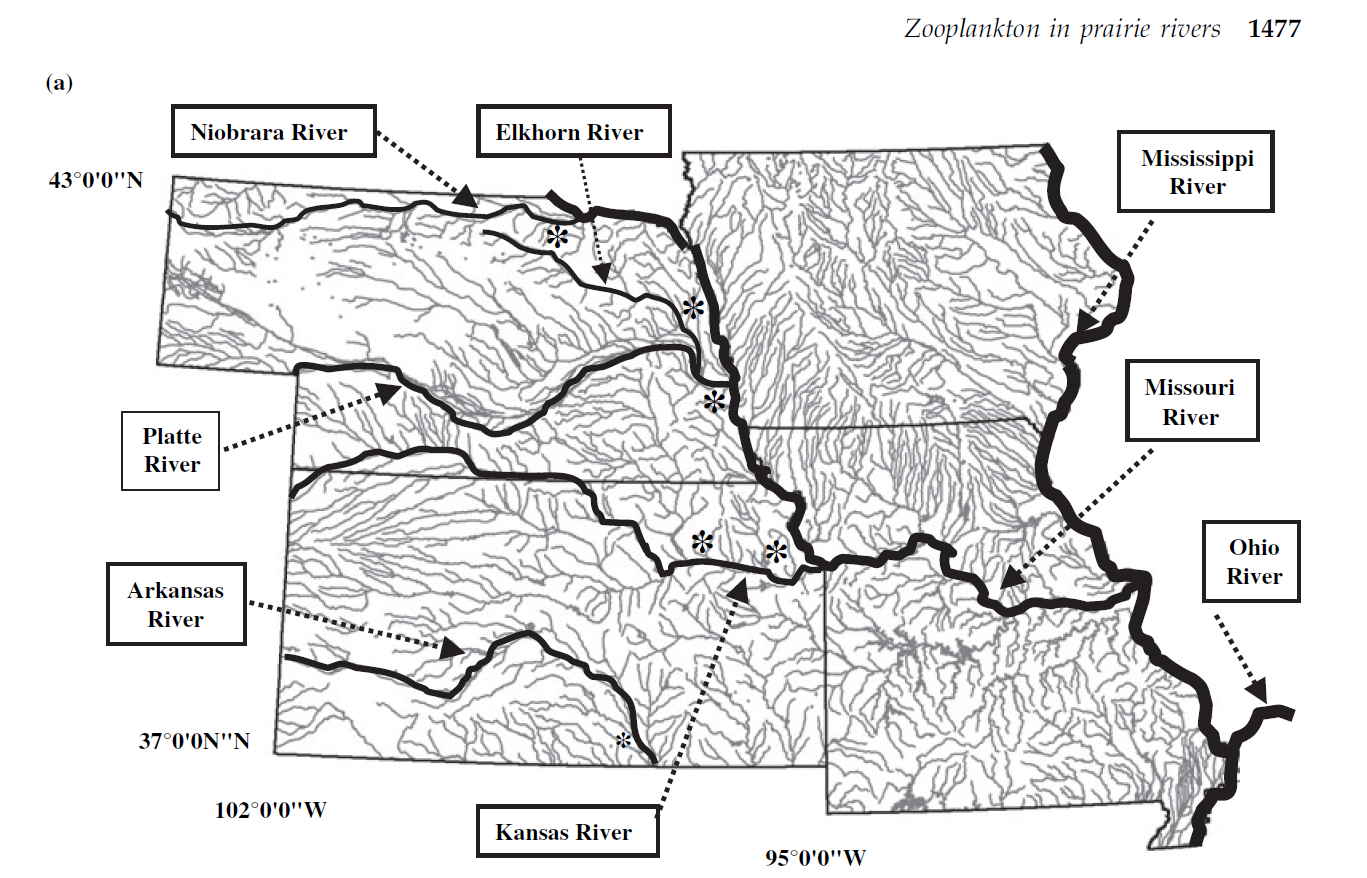
These rivers are sometimes used for irrigation of crop fields. For example:
- The Elkhorn River's "Flows vary considerably along its entire length depending on snow melt, rainfall and irrigation demand." And "the Elkhorn's water levels will be lower after mid-July through August because of high temperatures, low rainfall, and crop irrigation, among other factors."
- This page says "A series of dams on the North Platte in Wyoming harness snowmelt from the mountains of Wyoming and Colorado. The projects generate power and provide water to several hundred thousand acres of farmland in western Nebraska and southeastern Wyoming. The project makes the central Nebraska Panhandle the state’s most extensive area of surface water irrigation."
- For the Niobrara River, "By late fall, river levels begin to rise as demands for river water for irrigation subside."
Thorp and Mantovani (2005) themselves say (p. 1479): "Direct or groundwater extraction of water for [...] agriculture is a serious concern for most prairie rivers."
Thorp and Mantovani (2005) note (p. 1476) that "All five prairie rivers are relatively wide for their discharge, shallow (often <2 m deep), and turbid compared with a typical river in a forested ecoregion."
What was the sampling depth? From p. 1479:
Seventy-eight zooplankton samples from the shallow Kansas River were collected in July to September 2004 from depths averaging approximately 32 cm using multiple grab sampling with small buckets [...].
Four to eight additional 20-L zooplankton samples per river per year were collected in the summers of 2003–2004 from the Arkansas, Kansas, Platte, Elkhorn, and Niobrara Rivers (total sample size = 48). Zooplankton were pumped (12-volt diaphragm pump) from approximately 1 m depth into a 20-L bucket [...].
Results
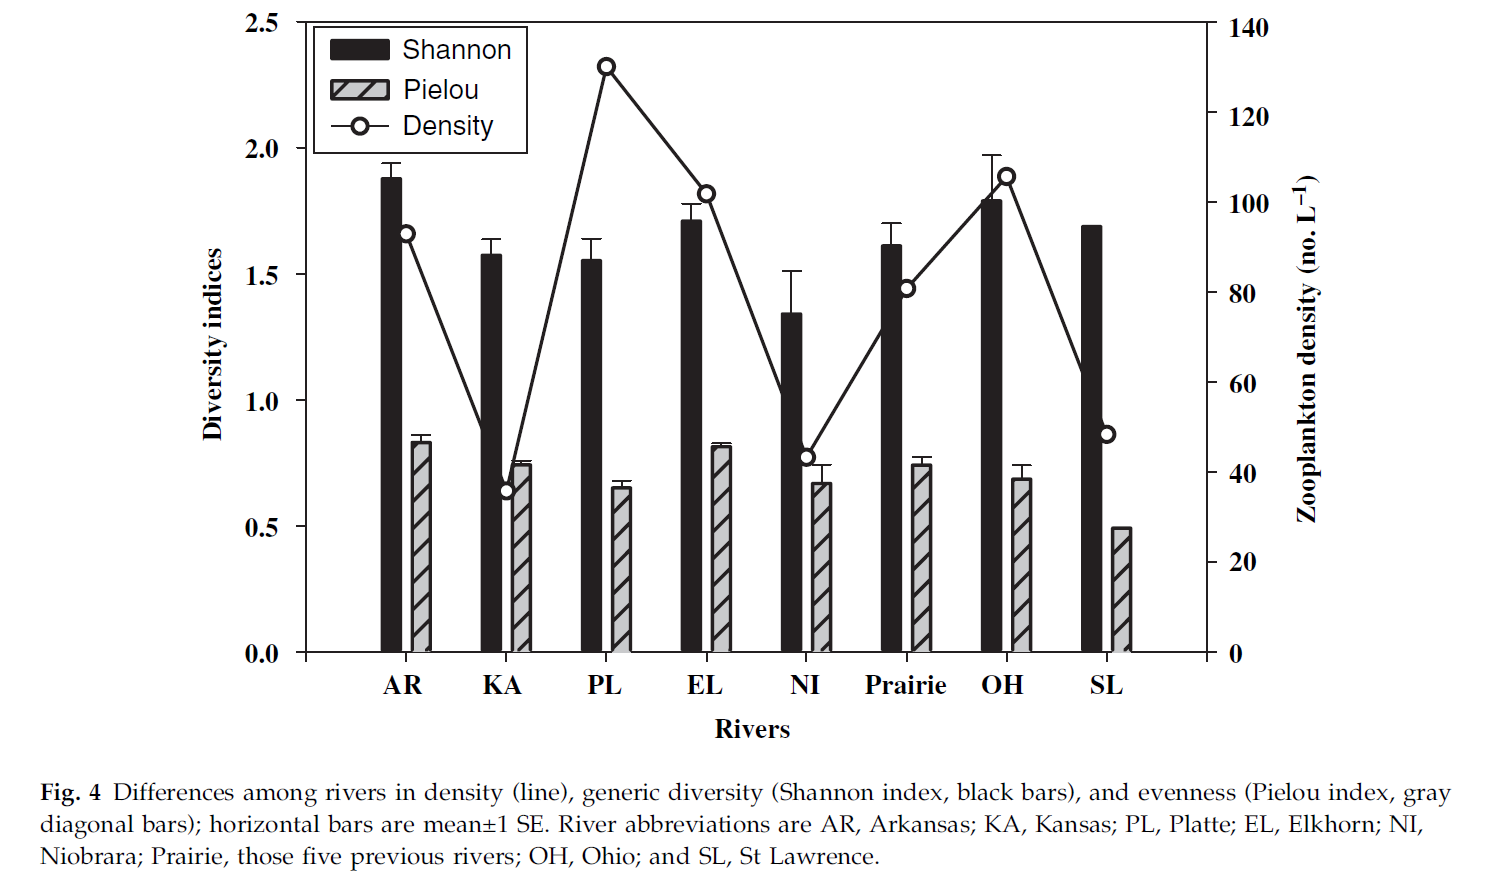
The following figure shows zooplankton densities (see the scale on right side). Average densities are on the order of 102 zooplankton per liter.
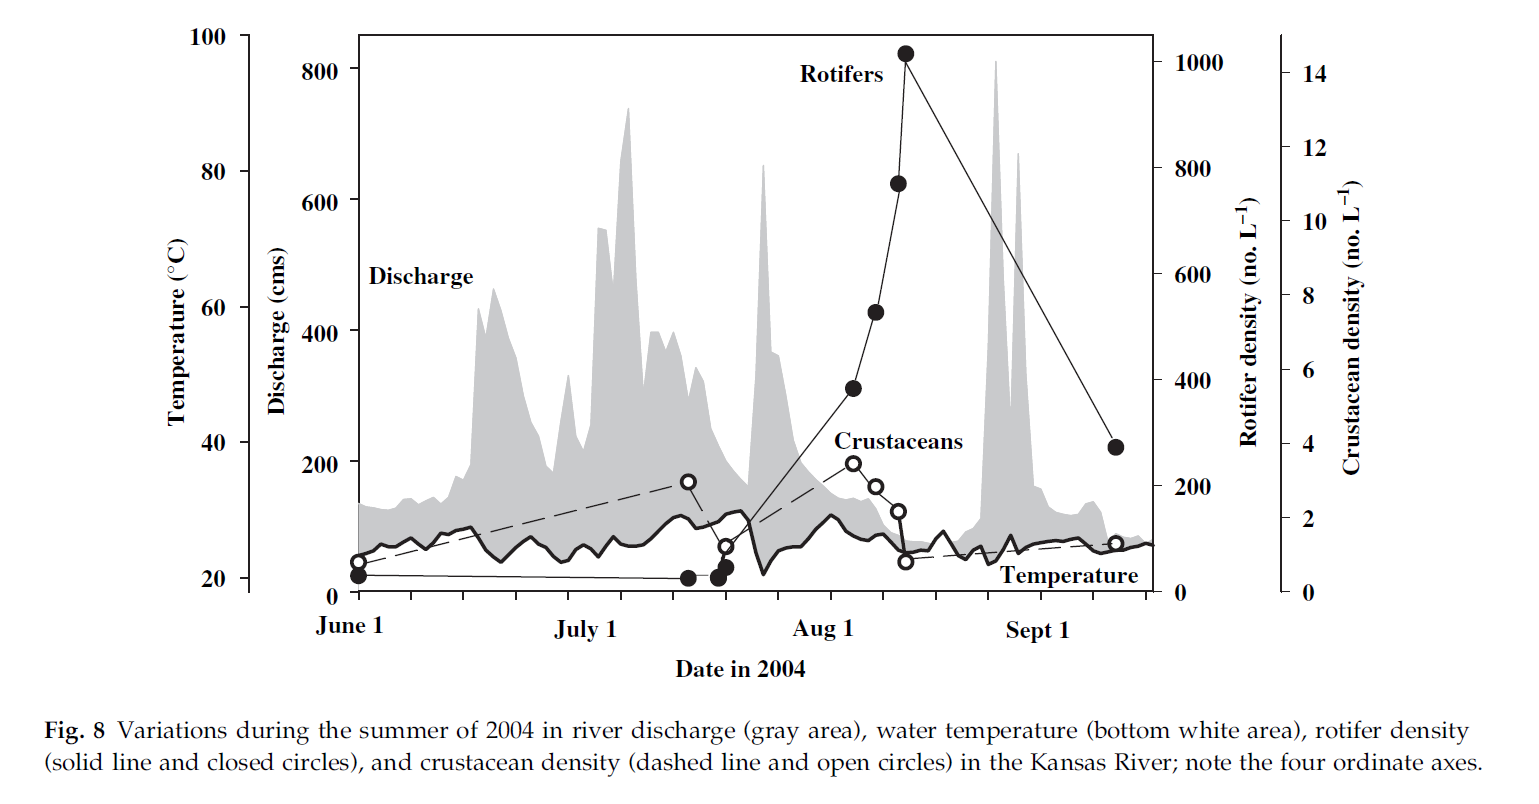
Most of the zooplankton were rotifers, as you can see in this figure of temporal variations in the Kansas River:
Summarizing their findings, Thorp and Mantovani (2005) explain:
Total zooplankton densities in prairie rivers (approximately 81 L-1) were intermediate between the Ohio (approximately 92 L-1) and St Lawrence Rivers (approximately 43 L-1), but relative abundances were significantly different. Rotifers represented >99% of zooplankton individuals in grassland rivers, but only approximately 37–68% in other rivers.
Zimmermann-Timm et al. (2007)
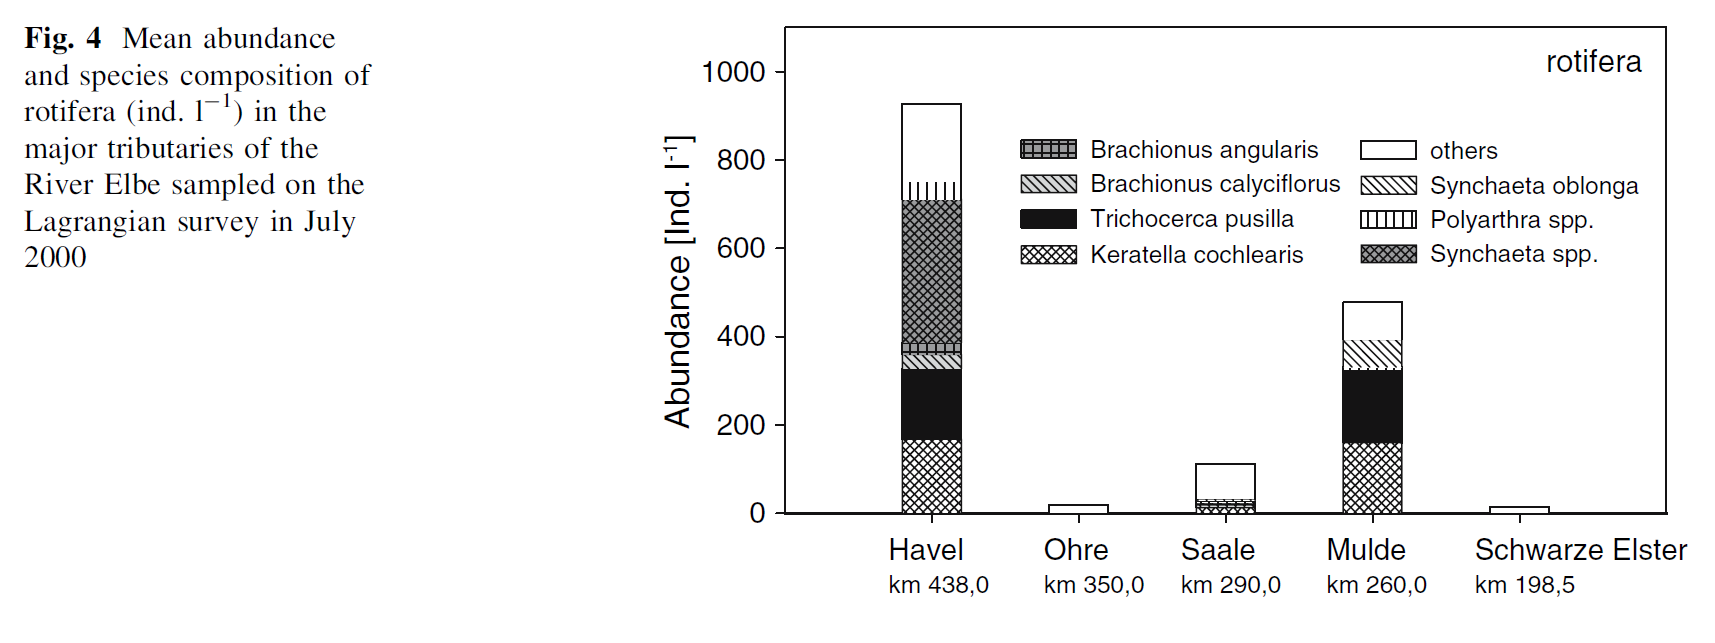
Zimmermann-Timm et al. (2007) examined "the Potamal region of the River Elbe" in Germany (p. 49). "Surface samples were taken from the mainstream at each station" (p. 50).
The following figure shows trends over the river, where larger Km values on the left side of the graph represent more downstream locations.
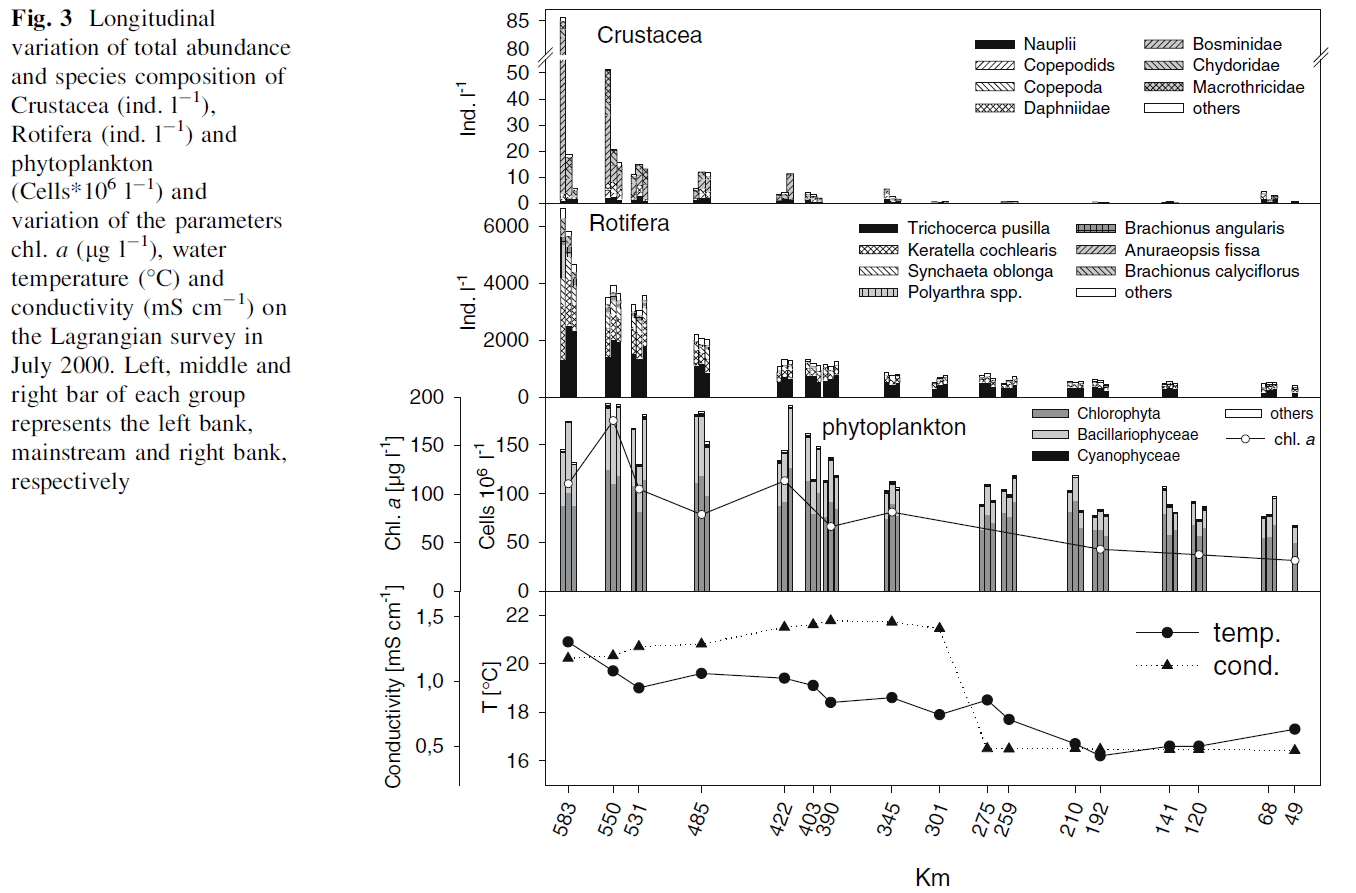
These densities are quite high. This is partly expected, as the authors explain (p. 50):
With a free flowing section of about 600 km, eutrophic conditions and a substantial growth of autotrophic and heterotrophic food organisms, the Potamal of the river Elbe provides potential favorable conditions for a distinct longitudinal zooplankton development (Meister, 1994; Holst et al., 2002). [...]
Increased sewage plant capacity reduced the organic pollution, since the reunification of Germany in 1990, but the Elbe is still one of the most polluted rivers in Central Europe (Adams et al., 1996; Guhr et al., 1996), with high nutrient concentrations and high conductivities
This figure shows rotifer abundances in major tributaries:
Napiórkowski and Napiórkowska (2013)
Napiórkowski and Napiórkowska (2013) examined the Vistula River, which "is the longest and largest river in Poland".
Sampling was done as follows (p. 1164):
All zooplankton samples (both qualitative and quantitative), were taken from the main channel (as is typical in studies of all water courses) (Greenberg 1992; Viroux 1997; Lair 2005) from the depth of 0.5 to 1 m using standard methods by means of a 5 dm3 Patalas sampler.
Because samples were only taken from the top ~1 m of the river, it's not clear how well the calculated abundances generalize to lower depths of the river.
The authors report the following abundances (p. 1166), where it's useful to remember that 1 cubic decimeter (dm3) is the same as 1 liter:
The average density of zooplankton in the lower Vistula River during the entire research period was 104 ind. dm−3 and varied from 34 ind. dm−3 to 348 ind. dm−3 (Table 3). Rotifera were the dominant group, which with an average count of 84 ind. dm−3 comprised 81% of zooplankton. Copepoda were dominant among crustaceans. The average count of copepods was 19 ind. dm−3, comprising 18% of the zooplankton. Cladocera accounted for only 1%, with the average count of 1 ind. dm−3 [...].
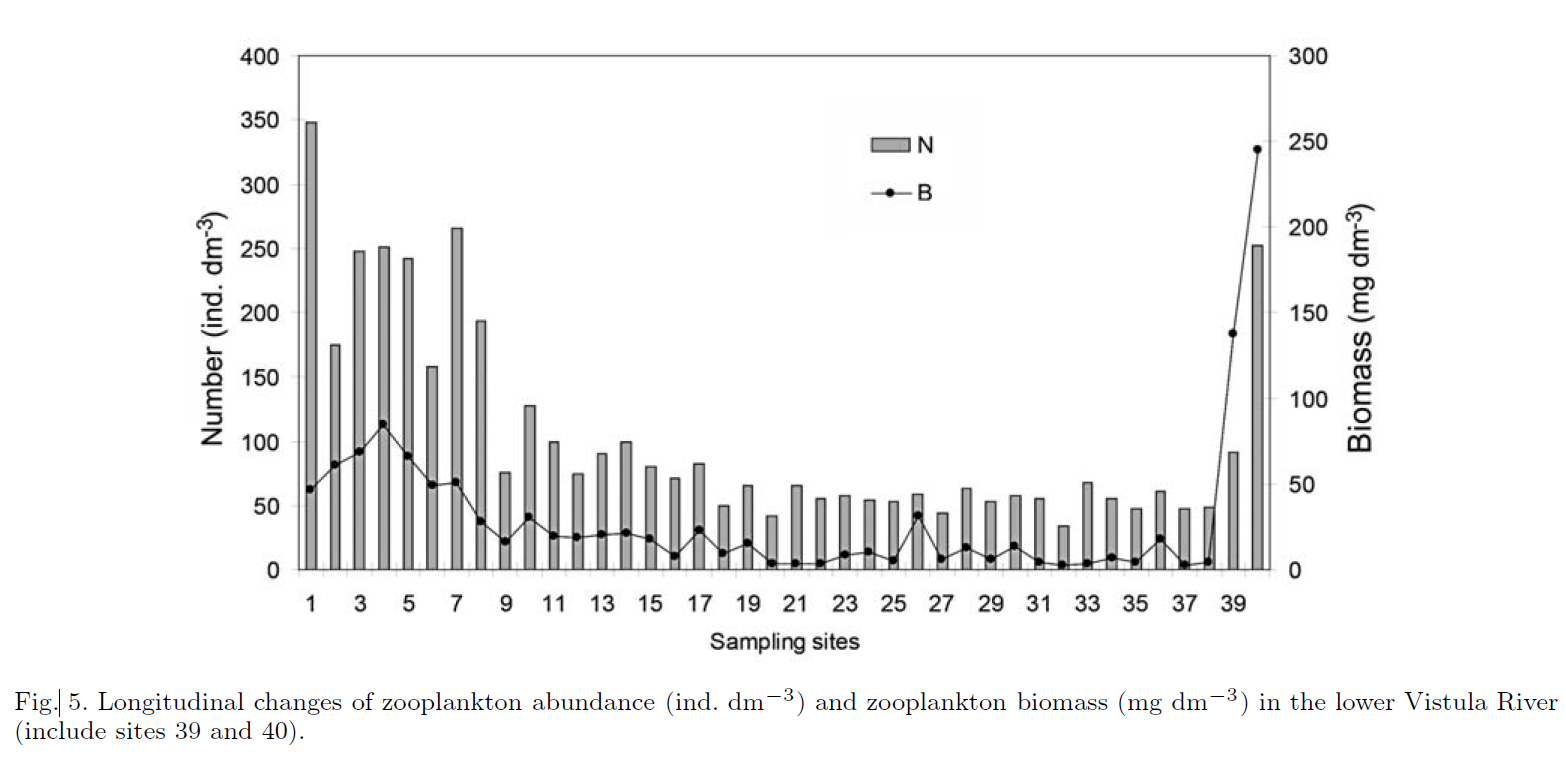
The lower Vistula River is "moderately eutrophic" and therefore "could provides [sic] the advantageous conditions for a distinct longitudinal zooplankton development" (p. 1168). Nonetheless (p. 1169):
The abundance and biomass of zooplankton of the lower Vistula River, were low in comparison to other European rivers (van Dijk & van Zanten 1995; Marneffe et al. 1996). There can be no doubt that the extensive river regulation and subsequent regimes of the river flow have had negative effect on the floodplain and (as a consequence) on river communities. The growth of invertebrates in transit is insufficient and under unregulated conditions riverine zooplankton is supplemented from adjoining stagnant water bodies connected to the river (Lair 2005). Although lentic (stagnant) water bodies (including river margins, side channels and floodplain habitats) which act as storage zones exist along the periphery of the Vistula river channels discharge for the studied section is too low (under 580 m3 s−1) to connect these storage zones and the main channel of the river, preventing import of organisms into the river (Napiórkowski 2010; Dembowska & Napiórkowski 2012). This explains the low abundance and biomass of the zooplankton in the lower Vistula River recorded during the study.
How I sampled the above studies
The above studies aren't a rigorously random sample of the literature, but I don't expect them to be significantly biased. I found them by Googling phrases like {zooplankton river densities} and {"potomoplankton" abundance} in Nov. 2016. I then skimmed the results and picked those papers whose authors had actually measured abundances and presented this information in a readily understandable way. I tried to get some diversity of locations of the rivers within Western countries (US Midwest, US coasts, Europe). Beyond that, I didn't apply particular biases.
Within zooplankton-abundance studies as a whole, there may be some bias for zooplankton densities to be too big, because people studying river zooplankton will tend to study those rivers that have appreciable numbers of zooplankton rather than those that don't.